
Tableau is one of the most renowned and accepted Business Intelligence tool for visually analysing the data by organisations all over the world. Tableau allows its users to create and distribute an interactive dashboard depicting the trends, variations, and density of the underlying data either in the form of graphs or charts. Tableau can connect to almost all types of data sources for fetching data. Data sources can be files, relational and Big Data; once the data is fetched it can be processed to meet the needs. Moreover, it allows data blending and real-time collaboration, which makes it very unique.
In this blog, we will cover:
- How to generate a Tableau report using data from a SharePoint List
- How we can integrate this Tableau report into a Modern SharePoint Site
- How to create a replication from the SharePoint list to SQL Server using SQList. This will create all the schema and keep the SQL data and schema in sync with the SharePoint list.
Once the data is in SQL Server, we will use Tableau to create reports using the exported data. The data export process from SharePoint lists to SQL Server can be configured to be either a continuous process or an On-demand one.
By the way, you can download a fully working version of SQList here
Here are the 7 simple steps to create a working Tableau report on a SharePoint list or library.
Step 1 – Connect to your SharePoint lists inside SQList
Launch the SQList Manager. If you haven’t set up a replication yet, your default screen would look like the diagram below.
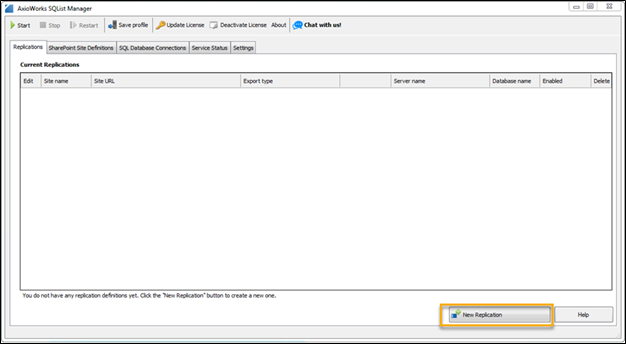
Click on the ‘New replication’ button in the manager. We will be setting up a replication from scratch. As soon as you select to create a new replication, SQList Manager will take you through a step by step wizard.
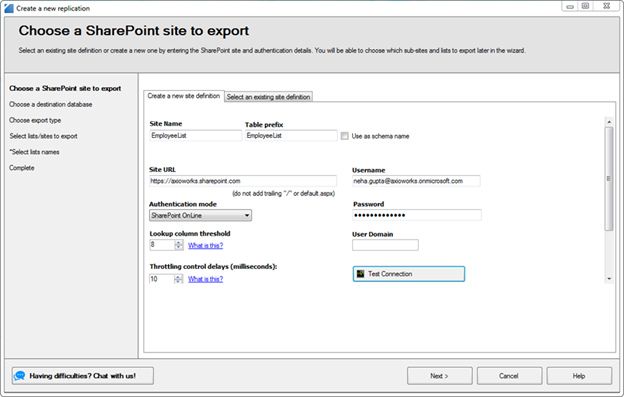
The first step will be to specify the details of the SharePoint Connection. The main details of a SharePoint connection include:
- Site Name: An arbitrary name of the connection
- Site URL: The URL of source SharePoint Site. It is important to note that it is the URL of the main site not a specific list or library.
- Authentication Mode: The type of authentication the SharePoint Site is using.
- Credentials: Username and Password for the user
Once you have provided the connection details, you can test the connection and save it for further use and click on Next button.
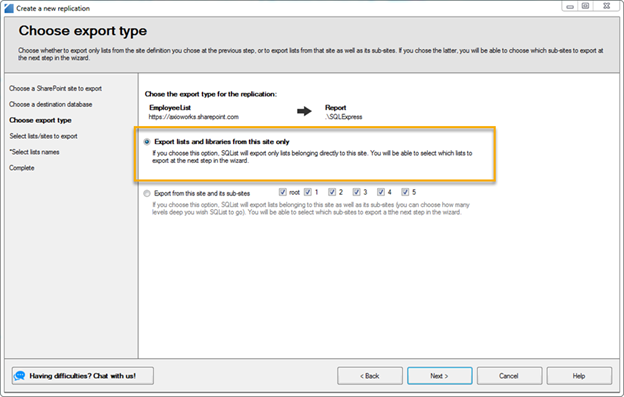
Step 2: Choose the SQList replication type
Select the type of replication you would like to perform, either specific lists and libraries or all lists of the same name across a site hierarchy.
From the perspective of our blog, we will opt for the first option and export a specific SharePoint list which we will then generate a report on in Tableau.
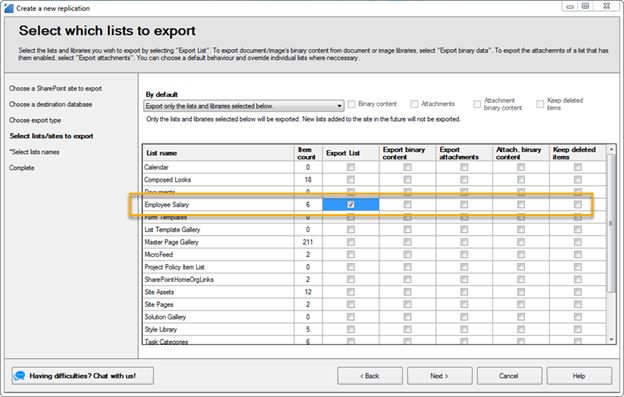
Step 3: Select the SharePoint list(s) to replicate to SQL Server for reporting in Tableau
Next, you are presented with a view where you can select which lists or libraries to export. We have selected the “Employee Salary” list for the purpose of the blog.
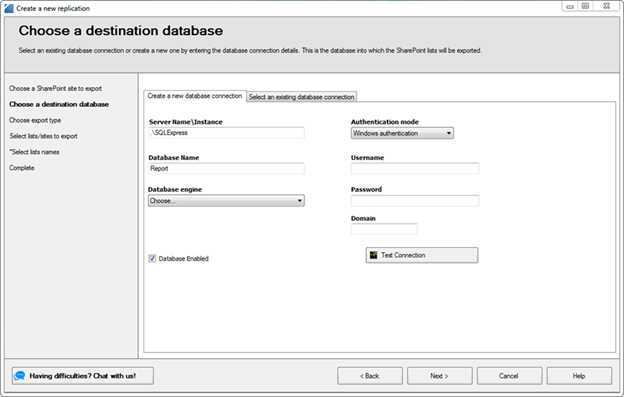
Step 4: Set up the SQL Server connection
Now as you have set up the SharePoint Connection, the next step for you will be to set up the SQL Connection. You will need to provide the basic details related to the SQL connection:
- Connection Name: An arbitrary name for the connection.
- Server Name: You need to specify the SQL server instance name.
- Database Name: You need to specify the name of the database where the exported data will be saved.
- Database Engine: You need to specify the database engine version
- Authentication Mode and credentials: Lastly you need to specify the authentication mode to be used to connect to SQL server and the appropriate credentials (User Name and Password).
Step 5: Start the SQList windows service
The replication configuration is almost complete we are left to check “Start the SQList service after saving the profile” so that the SQList windows service starts replicating the data to SQL server immediately
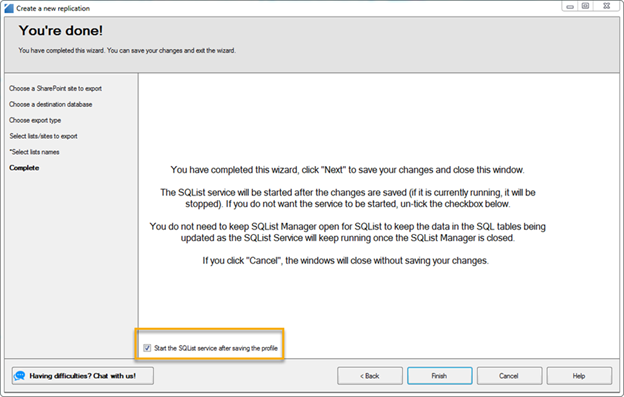
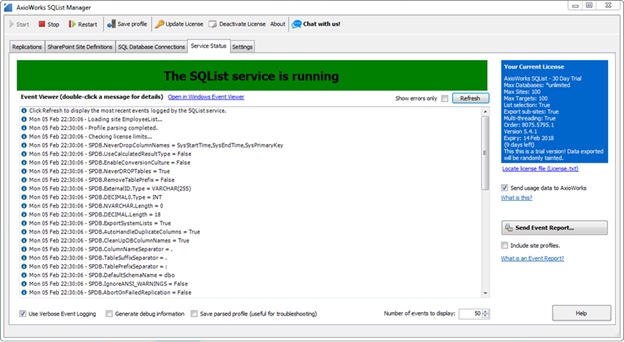
As soon as you click “Finish”, the replication configuration is complete and the SQList starts the replication of the SharePoint list. You can always check the status or logs of the replication in the “service status” tab.
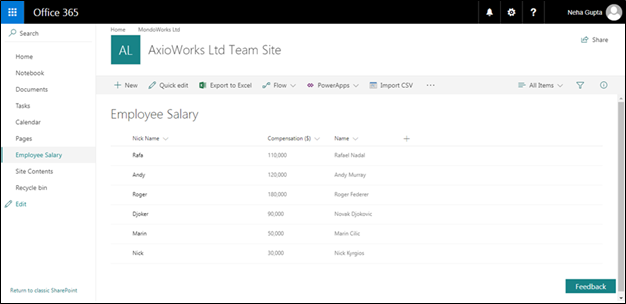
For reference purposes, let’s look at the structure and data of the list that we have exported. The Employee Salary list contains compensation data for employees in a company. (The data is random and names are chosen on random basis J )
Step 7: Create Report using Tableau
Now as we have imported the SharePoint list data into SQL Server, we will now use it to generate a sample report (Chart).
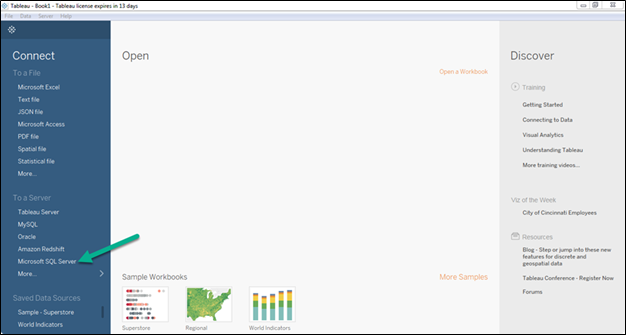
Let’s launch the Tableau Desktop app. For the purpose of this blog, I am using version 10.5 this will work with previous versions as well.
As soon as you launch Tableau, we need to connect to a server which will serve as a data source. In our case, we will be using SQL Server as the server. Click on ‘Microsoft SQL Server’.
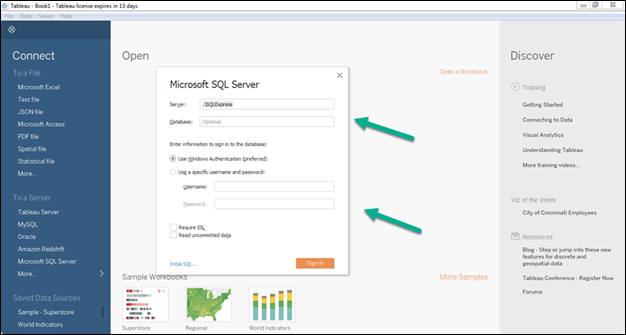
As soon as you click on SQL Server, it will ask you for credentials with the help of which it can connect to the server. You can specify the same details which we specified in our SQL connection in the previous step as that server will serve as our data source for the report.
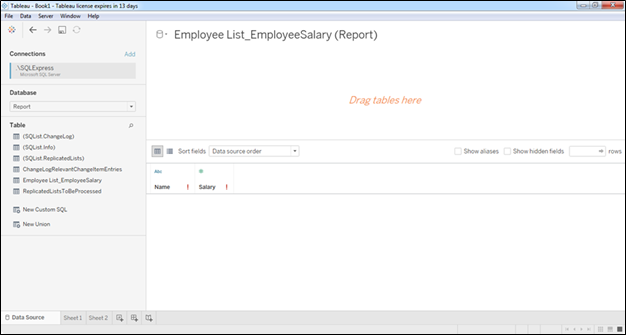
Once you have provided the correct SQL Connection details and signed in, then you need to specify the database. Our Employee Salary list was exported to the Report database. So, I will select Report database.
As soon as I select the Report database, the table pane gets updated with all the tables present in the database. We are concerned with the EmployeeList_EmployeeSalary.
Drag the Employee Salary table to the table section and click on “Update Now” in the bottom section. Then the bottom pane will show the data present in the table.
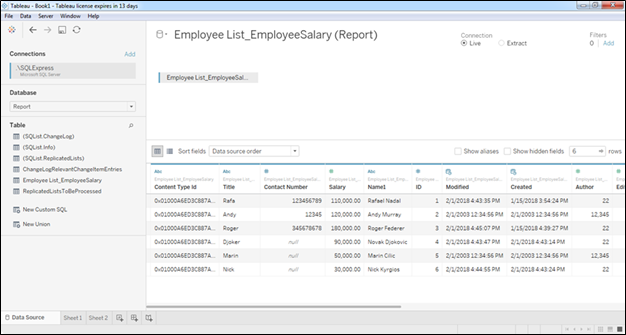
Since we will be using a single table as the source we can go ahead with the creation of the chart. If your chart requires more than one table then you can drag all the required tables and join them on the appropriate columns.
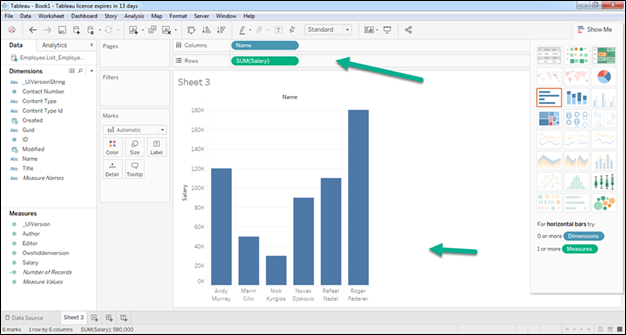
The next step will be to create a Sheet where we will plot a chart. Click on the Sheet at the left bottom. It will open up a new sheet. Now you need to specify the type of chart. We will select a bar chart for our purpose and we will show the employee and salary against each player. Since, we will be showing Employee VS Salary in the graph, drag the Name column in the Columns section and salary in the rows section as highlighted below. You can see that a chart will be rendered now.
So, the chart creation is complete and you can save the report for further use. We have chosen a very basic use case for the purpose of the blog but it can be extended a lot further depending upon the requirement, whether you want to export huge chunks of data residing in different lists (supported by SQList). Even if you want to generate a complex report with data coming from different tables is easily feasible from tableau prospect.
Feel free to post questions and feedback. Thank you!