In this blog post we will look at SSRS 2016/2017 with SharePoint 2016 in detail and in particular:
- What SSRS is and how it fits into the Microsoft BI stack
- The various components that make up the SSRS toolset
- What’s new in SSRS 2016/2016
- How to set-up SSRS to be used with SharePoint 2016
- How to write a SharePoint 2016 Report using the OOB connectivity
- How to configure SSRS 2016 SharePoint integrated mode with SharePoint 2016
- Using SSRS to report on SharePoint Online and SharePoint 2016 data
- Viewing SQL Server Reporting Services (SSRS) Reports in SharePoint online
What is SQL Server Reporting Services (SSRS)?
SQL Server Reporting Services, part of the Microsoft BI stack, is a Server-based report builder software provided by Microsoft which allow us to create and manage a range of reports and dashboards from different data sources with a large variety of data visualizations
The SSRS service provides an interface in Microsoft Visual Studio as SQL Server Data Tools so that developers and SQL Administrator can connect to SQL databases and use SSDT tool to implement SQL reports.
Nontechnical users can use Report Builder tool provided by SSRS to format SQL less complex reports. You can extend reporting functionality by means of C# and VB as programming languages.
Users van either interact directly with Report Server Web Service (RSWS) or use Report Manager (A Web-based application that interacts with the Report Server Manager).
Users can view, subscribe to, organize, and preserve data sources and Security Settings.
All these reports can be viewed through a browser.
RDL defines Reports which can be downloadedto various format like Excel, PDF, CVS, XML and HTML Web Archive.
Report Manager provides functionality to send SQL reports by e-mail, also the user can place them into file share.
SSRS provides a host of security features, to control, who sees which reports etc.
>SSRS provides a role-based security model, Security can be assigned to an entire site, folders of items, individual report or data source.
By default, Security roles are inherited and it can be overloaded.
SSRS administered by a web interface, which can be used to produce variety of interactive and printed reports
RDL reports can be viewed by Standalone Report Server associated with Microsoft SQL Server, or by using ASP.NET Report viewer control, or report viewer (Windows Forms control).
SQL Server Reporting Service solution customers deploy on their own premises for organising and publishing reports. These reports can be sent to the particular user in numerous ways. These reports can view on all platform like the web browser, mobile or email.
The ad-hoc reports also supported by SSRS, the designer can develop a report and deploy the same on the reporting server, while the user can choose applicable fields/data to generate reports.
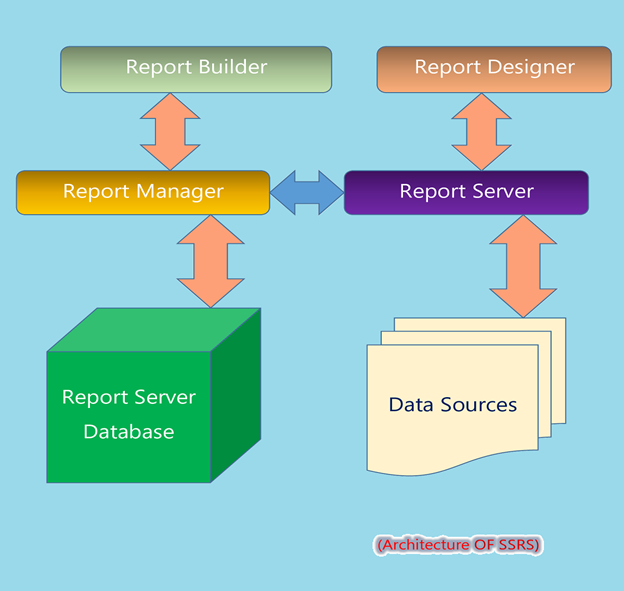
This architecture contains following types of components and tools.
- Report Builder
- Report Designer
- Report Manager
- Report Server
- Report server database
- Data sources
Report Builder
Report Builder is Standalone development tool to create Reports outside of SQL Server Development Tools (SSDT Visual Studio).
At the time of Report designing, the user needs to specify “Where to get Data“, “Which Data to get“, and “How to display Data“.
While running the report, the report processor uses all the information user have specified, retrieve associated data and combines it with Report Layout to generate the report.
This tool can be used by the non-technical user to authoring the report as its easier to use.
Report Designer
Report Designer tool used to create Simple as well as complex report using SQL Server Development Tools (SSDT Visual Studio)
Its provide the graphical interface in which user can define “data sources“, “datasets“, “queries“.
The user can also define “Report layout positions for data regions and fields“.
The user can also define interactive features like “Parameters” and “Sets of reports” that work together.
Report Manager
Report Manager is a Web application to access and configure reports.
Report Manager can be accessed over the remote location with HTTP connection.
User can use Report Manager to access the folders and search reports with its general property along with historical copies of report that are saved in “report history.“
Report Manager is only working with the report server that runs in Native mode, it’s not supported by SharePoint integration mode.
User can open Report Manager with http://ServerName/Reports (“ServerName is name of the server where Report Manager is deployed“)
Report Server
A Stateless Server uses the SQL Server Database Engine to store Metadata and Object Definitions.
Report server database
Native Mode Report Service Installation use two databases to separate persistent data storage from Temp Storage requirement. Those databases are created simultaneously and bound by their name.
Name of databases are:
- ReportServer
- ReportServerTempdb
Report Server Database stores:
- Reports, Shared Data Sources, folders etc.
- Execution logs
- Encrypted connections and symmetric keys
- Credential for data sources
Report Server Temp Db stores:
- Session and execution data
- Cached report
- Work report generated by report server
For SharePoint integration mode, a user needs to configure the “Manage reporting Service Application” service from central Administration.
Data sources
Reporting services can consume data from relational as well as multidimensional data sources.
Why would it be used?
The company has lots of data collected from various location and various sources. With this plain textual data company not able to get insights of data and failed to decide due to the same.
That is where SSRS comes into the picture, SSRS consume data from various data sources and create analytics chart based on parameters and filters which help end users to get proper insights of data and based on insights company will take require the decision.
The company can experience various advantages of SSRS, some of are:
1. Ease of deployment & centralised reporting
Reports are stored in the centralised server so end users can get all the reports from one place and which makes overall deployment process easier.
2. Easy export to multiple file format
The user can able to access and share reports in HTML, CSV, XML, PDF, and images (TIFF), SSRS also offer complete rendering in MS Word and Excel. Since reports are fully editable in MS office suite hence end, user can create the custom document based on their requirement.
3. Develop centralised reporting portal
Organisation can bring together all structure and non-structure data from across the company at one centralised location which help end users to see business performance at one glance
4. Make the report based on schedule by report subscription option
SSRS support both standard and data-driven subscription; one can share SSRS report via Email or file share to the particular user. The user also gets reports based on a schedule and report parameter value.
5. Sorting & drill down capability
Users can apply sorting functionality on any column in ascending or descending manner also they can easily drill through any composition of the data pattern in the database.
6. Security
SSRS implements roles based security model to protect reports; this means every employee of organisation can only allow access to report based on their authorisation.
What is new with SSRS in SQL 2016/17
2016 SSRS
Microsoft released many new features in Reporting Services with the SQL 2016 release:
- Paginated reports
- Mobile reports
- Web portal
Paginated reports
This report is ideal for fixed layout documents used for printing, for example, PDF.
- Users can create the report with minimalist modern style.
- Users can arrange parameter however they want.
- Users can create hybrid POWER BI experience, hence instead of recreating POWER BI in an on-premise server, they can reuse some of the components from those reports to Power BI.
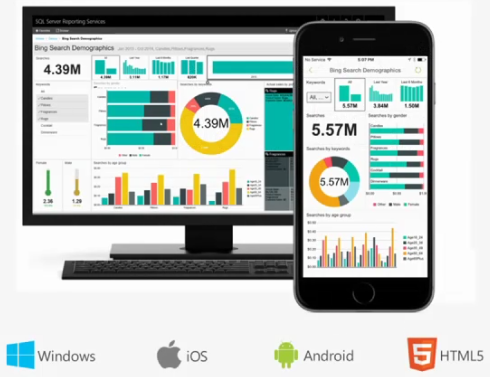
Mobile reports
Microsoft has added new report type i.e. Mobile report which incorporated with responsive layout. Hence the user can create the report in Mobile Report Publisher and PowerBI Apps for the mobile device for Windows 10, IOS, Android, and HTML5.
A user can access data which is hosted in POWER BI Cloud and on-premise SQL 2016 Reporting Service.
As user create visualisation, Mobile Report Publisher automatically generates Data for each visualization
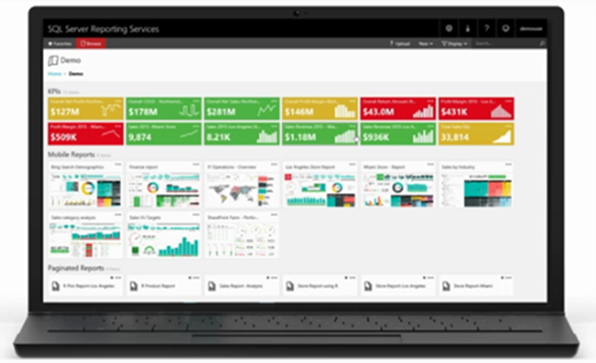
Web portal
The Web portal is the presentation layer for all end users of native mode Reporting services, which can be view in any latest browser
The user can have access to all Reporting Service mobile, Paginated reports, KPIs and POWER BI desktop reports in the Web portal.
The user can write custom KPI directly in Web portal also can apply custom branding.
The web portal is more like a Report Manager with the Single page, HTML 5 app.
2017 SSRS
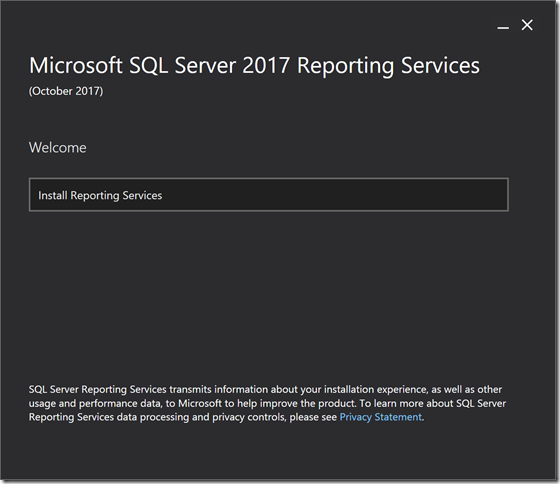
From SSRS 2017, Microsoft has separated the SSRS installation package from SQL Server installer.
If an organisation has SQL Server Reporting Database (from 2008 to 2017), they can easily download & install reporting service.
Now since this installer is separated from SQL Server installer, hence the user can install the latest version of Reporting Service and it has zero impact on SQL Server Databases or features.
REST API
REST API gives programmatical access to the many objects of reports server catalog such as:
- Folders
- Reports
- KPIs
- Data sources
- Datasets
- Refresh plan
- Subscription and more
Using REST API, user can:
- Folder hierarchy navigation
- Search content of folder
- Download report definition
- Can perform CRUD (Create, Update, Delete) operations on objects like
- Upload a report
- Delete a folder
- Execute refresh plan
Microsoft has built OpenAPI Specification (Swagger Specification). This SwaggerHub helps the user to generate Client library in JavaScript or typescript, Java, C#, Ruby and many more. Hence the user can choose whatever language they prefer to generate client library.
Report viewer for SharePoint & Dot net
If the developer has ASP.Net Web Forms App with Report Viewer Control to integrate Paginated RDL reports then Developers can download latest NuGet package for Dot Net & integrate Cross browser printing, modern Browser support with the modern look.
Developers also integrate Report viewer web part into SharePoint 2013 – 2016 and get benefits like Show or hide particular toolbar buttons, override report parameter values and connect Filter web part with report parameter and this all can be achieved without SharePoint Integration mode.
Report comments
Comments facility has been enabled for reports, hence end user can start the discussion about a particular report.
Attachment functionality also integrated with comments.
The administrator can manage permission about comments like who have authorized to read or write comments at the folder level or report level.
POWER BI Report Server
POWER BI report server includes all capability of SSRS and administrator can migrate all SSRS report into POWER BI with entire report server database.
How to set-up SSRS to be used with SharePoint 2016
The Reporting Services report server can be configured in SharePoint mode to run in the SharePoint Environment.
Report Server can use reporting service content types in SharePoint.
Appropriate version of Reporting Service is required to installed in SharePoint environment
There are Two types of installation mode of Reporting Service: “Native” mode and “SharePoint-integrated” mode.
SharePoint Administrator support is requiring for configuring reports in SharePoint Integration mode to implement changes in Central Administrator and published the SSRS reports into SharePoint page.
Native mode offers full features of reporting service like the paginated report, web portal, KPIs and many more.
SharePoint 2016 mini roles were attempted to offload SharePoint from some functionality.
- Front-end
- Application
- Distributed cache
- Search
- Custom
From SQL Server 2017, there will be only one installation mode for Reporting service which is native mode.
- Embedding reports in SharePoint pages. The user can embed all types of reports into “Page Viewer” web part using rs: Embed=true URL parameter.
- Reporting on data in SharePoint lists. The user can use the Native connector for SharePoint list data in Report builder and PowerBI to query SharePoint data and report analysis.
- Delivering reports to SharePoint libraries. Since Microsoft have planned to develop a “SharePoint Delivery Extension” with native mode, hence user can schedule reports in various format like word, PowerPoint, pdf etc. to SharePoint document library
Configuration of SSRS 2016 integrated mode with SharePoint 2016
SQL Server Reporting service has changed a lot in SQL 2016. The process to set up SSRS in SharePoint 2016 is change a little. The process involves:
- Installation in the SharePoint
- Create and configure Service Application
- Deploy solutions
- Document library configuration to store reports
Installing SSRS on SharePoint Servers
While running in integration mode, SSRS needs to install on any server within SharePoint farm as SSRS deployed as SharePoint service application.
Min role is relatively new to SharePoint 2016 and SSRS does not support any role than the custom role.
If server is not running the custom role, SSRS installation can be done but SSRS will shut down by role engine during next maintenances windows
User can check server roles using:
Central Administration => System Settings => Servers => Convert Server role in the system
This will redirect to role conversion dialog
If the role is set to custom, its fine else user needs to change with “New Role” drop down.
Once role is properly configured, SSRS can be installed,
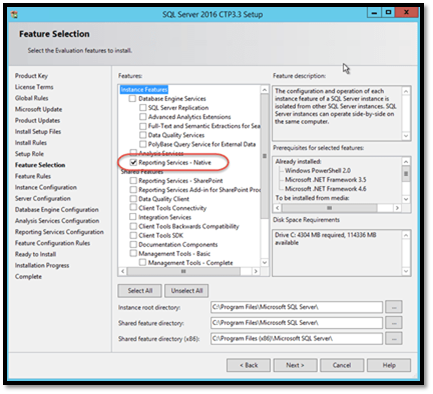
SSRS integration mode can be found in “Shared Features” collection.
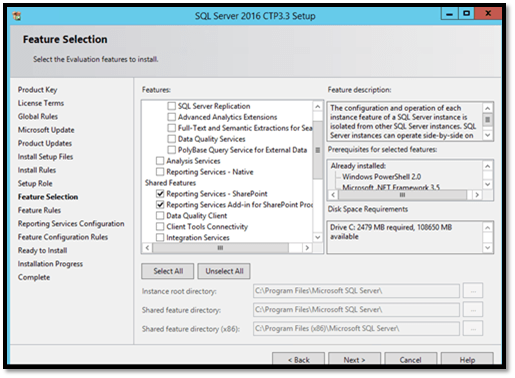
It contains two options:
- Reporting Services- SharePoint: This is main SSRS Service Application. This needs to install on any SharePoint server to render the reports.
-
Reporting Services Add-in for SharePoint …: This option establishes connection between SharePoint server and the instance of SSRS Service application.
After this, click “next” and “finish”, SSRS will be installed on a server.
Create and configure SSRS Service Application in Central Administrator
Verify user account which is creating Service application is the member of Farm Administrator group for the farm.
Follow the steps to create SSRS Service Application
Central Administrator => Application Management => Manage Service Application
On “Manage Service Application” page click “New” and click “SQL Server Reporting Services Service Application”
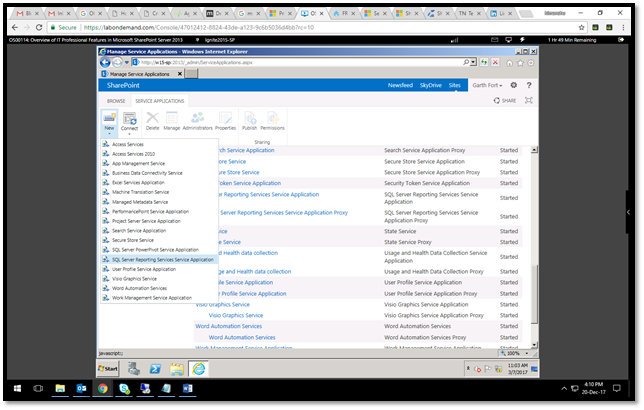
A configuration dialog will be open where the user can enter “Name of Service” and another relevant parameter.
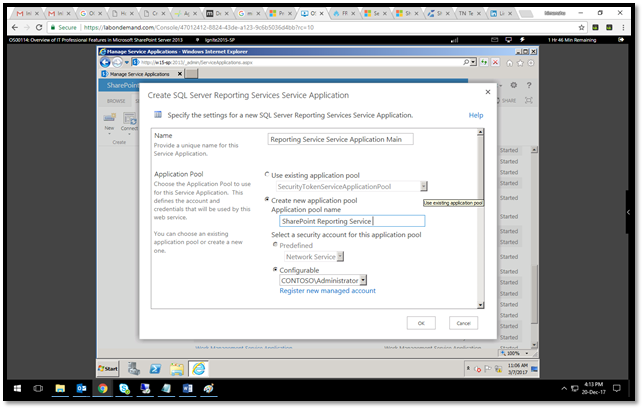
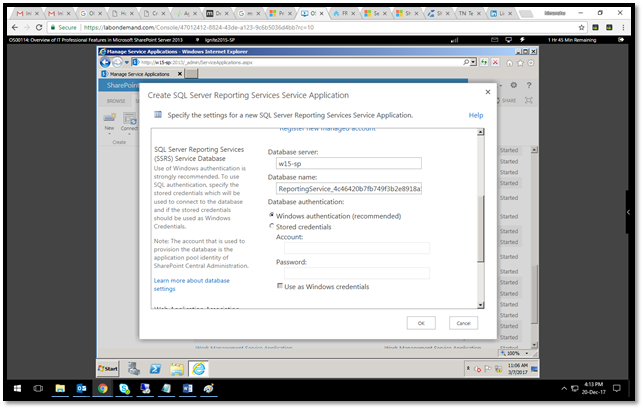
Its good practice to change Database name as default name contains GUID.
There will be 3 databases created for SSRS services, one is mention above and two other databases which will use above Database name as the base.
You can also active SSRS feature in all Site collections if required, the same can be done from particular site collection as well.
Report Library creation
The user can create document library from SharePoint server. Don’t select “Report” or “Report Document Library” template while creating Document library as it has no connection with SSRS. Simply select a Simple document library.
Add SSRS content types to the library
- Go to library settings
- Advanced settings
- Enable use of content types
-
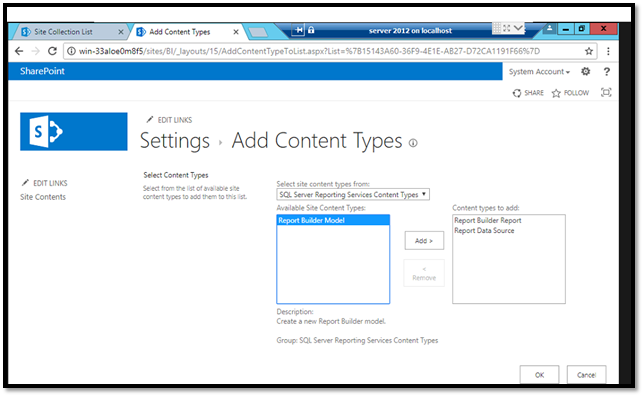
Add “SSRS content types” by add from existing content types.
- Select “SQL Server Reporting Services content types”
- Select “Data Connection”
- Select “SSRS Reports”
- Select “SQL Server Reporting Services content types”
Please note: Don’t use “Report Builder Model” content types if it’s not required as it is depreciated and used with backward compatibility
After this, SharePoint Administrator can remove “Documents” content types and create new reports or data source in this document library.
Now library can be used to store reports.
How to write an SSRS using SharePoint 2016 list data
Microsoft has declared that from SSRS 2017, there will be one installation mode for Reporting Service which is “Native” mode.
It will be Stand Alone Business Intelligence Solution on SharePoint.
As mentioned in above section What’s new in SSRS 2017, there are many new features introduced with SSRS 2016/17
- Web Portal
- Paginated Report
- Mobile Reports and many more.
Native Mode Reporting service integration with SharePoint gives benefits:
Embedded reports in SharePoint Page: embed all reports types in a Page Viewer Web part using the rs: Embed=true URL parameter.
Reporting on data in SharePoint lists: the Native connector is used with PowerBI and Report Builder to query SharePoint data and visualize in reports.
Place reports to SharePoint Library: SharePoint delivery extension for native mode available soon to delivery reports in Document Library.
Install SSRS in Native Mode
While installation SQL Server set up, Administrator needs to install “SharePoint Add-in” only to use for SharePoint integration mode
Configure SSRS 2016
Configure Web Service URL
Once the require fields are filled, user needs to click on “Apply” button to configure Web Service
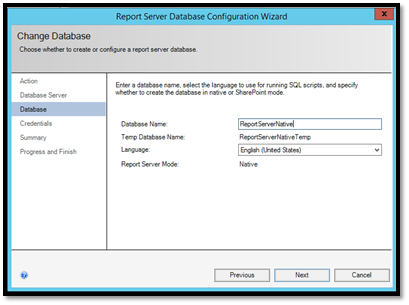
Configure Database
In this section, Database Administrator needs to create or change Reporting Server Database name.
Here Database Administrator can write Database name, by clicking next, two new databases will be created.
- ReportServer
- ReportServerTempDB
In this section, we will demonstrate how to use SharePoint List data as Data Source in SSRS 2017 and create paginated report and deployed on Reporting Server.
Create Paginated Report using SharePoint List Data as Data Source
Below are the steps which give you information about how to use SharePoint Data as a Source and create Paginated Report.
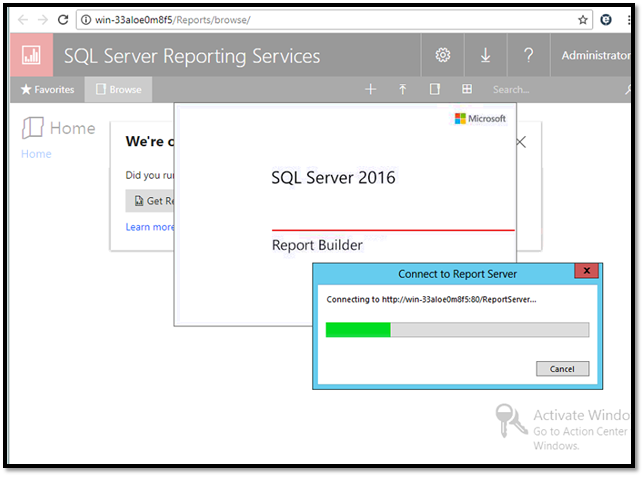
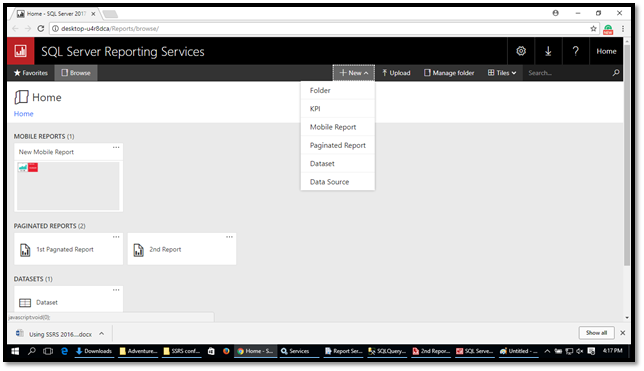
Connect to Report Server
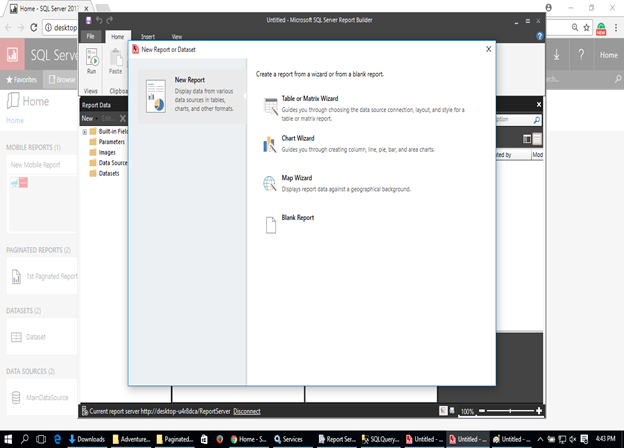
Go to the Report Server Url and click on +(Add) sign and choose Paginated Report, it will open Report builder.
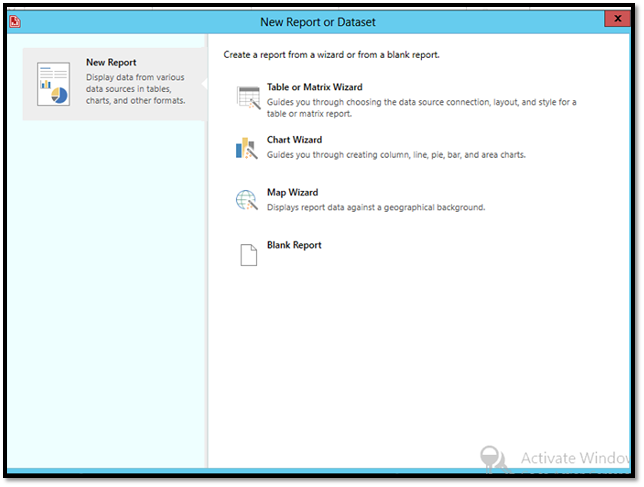
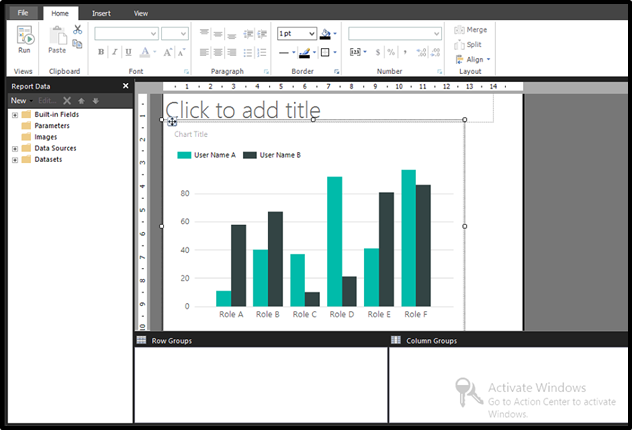
New Report & dataset
Once Report builder open, the user needs to create Report & Dataset, here we have selected Chart Wizard.
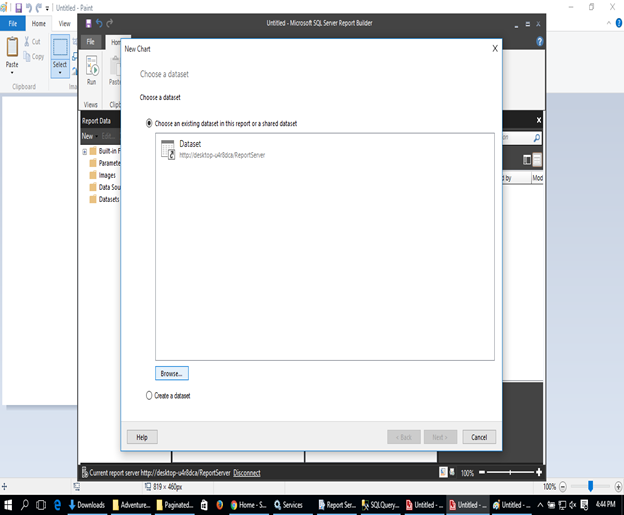
Choose Dataset
After selecting Chart type (in our case it is Chart Wizard), the user will redirect to Choose Dataset screen. Here we have Selected Create a Dataset option.
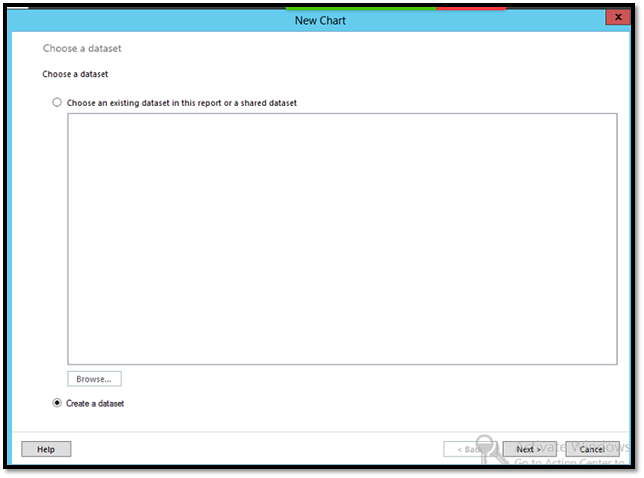
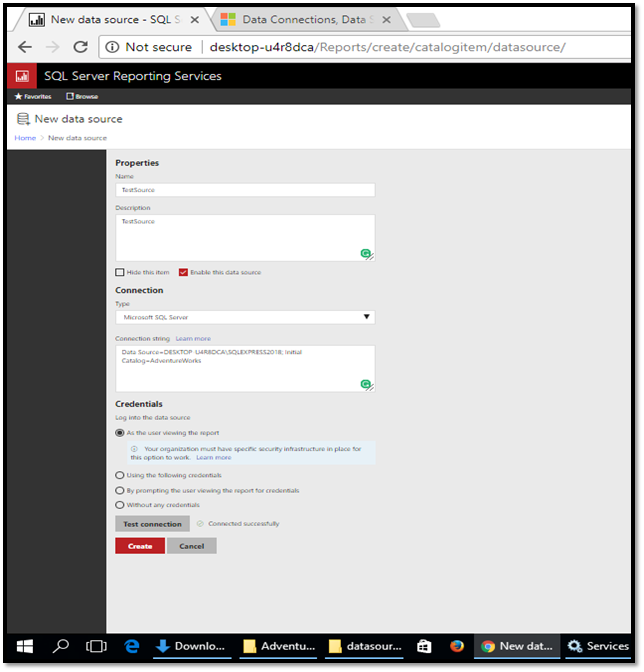
Create Data Source
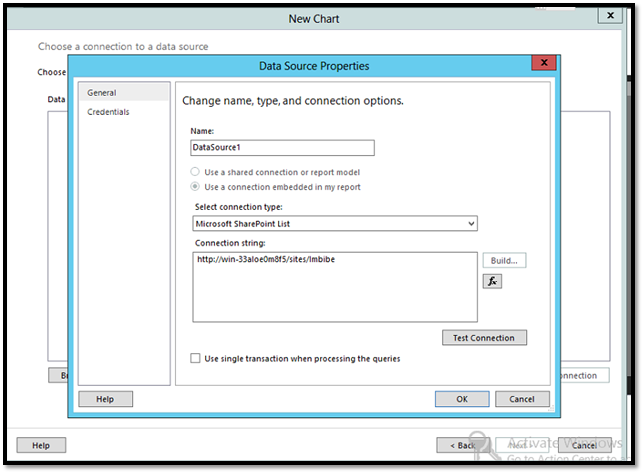
Once you selected “Create a Dataset”, you will be redirected to “Create Data Source” screen.
Here, you can give “Name of the Data source“, “Select connection type” and Connection string.
The user needs to choose “Microsoft SharePoint List” in a Select Connection Type option in order to establish the connection between SharePoint & SSRS and to fetch data from SharePoint List.
The user needs to enter “Site Name” in a Connection String Textbox, to establish particular SharePoint site connection to SharePoint.
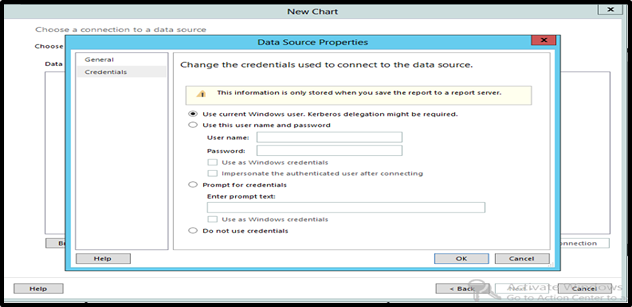
Specify Credential in Data Source Properties
Here, we have selected “Use Current Windows user. Kerberos delegation might be required” option, as we are using Windows Authentication and the current user has administrator privileges in SharePoint and SQL.
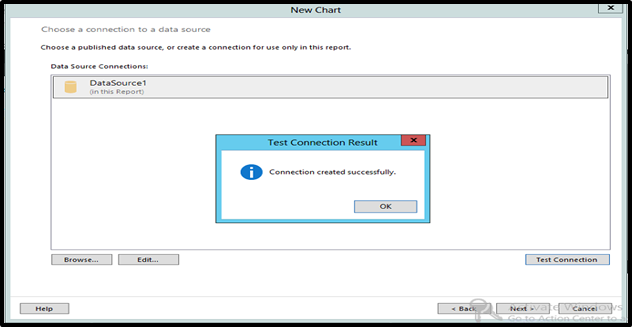
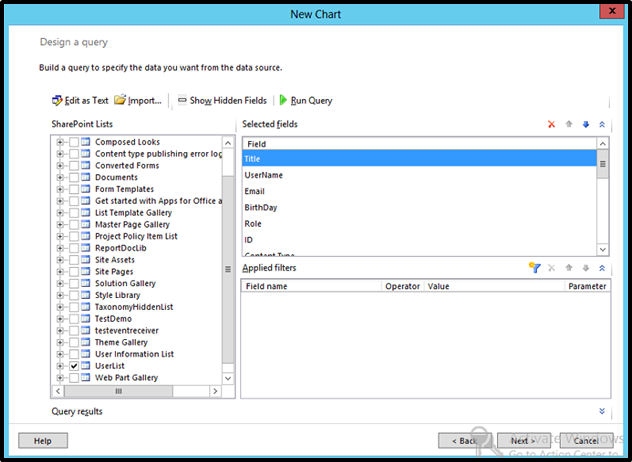
Design Query & Select List
Once connection establishes successfully, when users click on Next, then they will redirect to “Design a Query” Screen.
Here the user can choose particular SharePoint List and its fields, also user can apply additional filters, here we have selected “UserList“
list.
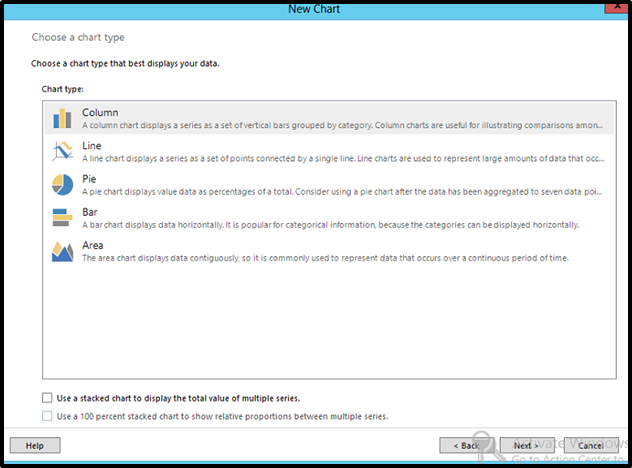
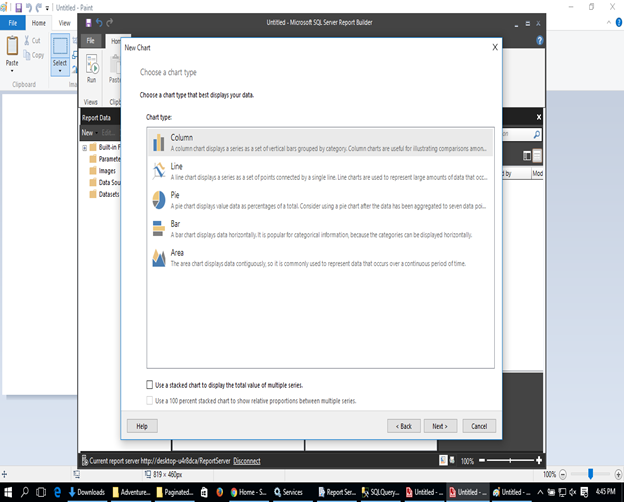
Select Chart Type
Once users click “Next” from “Design a Query” screen, they will redirect to “Choose a Chart Type” screen.
Here users can select any chart types from available default chart type. We have selected column Chart type.
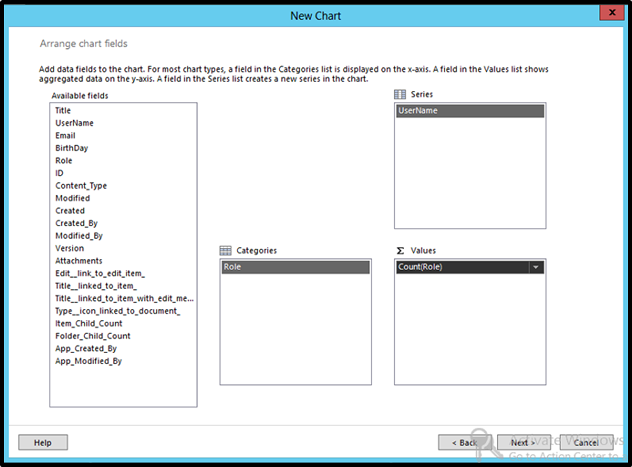
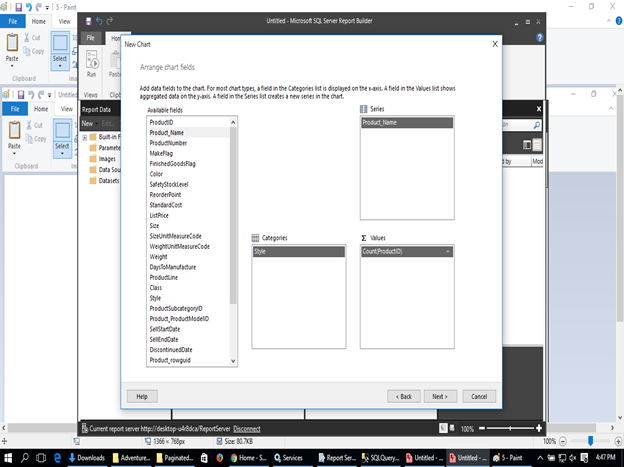
Arrange Chart Fields
Once users have selected particular chart type, they will redirect to “Arrange Chart Fields” from here users can select any field to configure into Categories, Series, and values column based on their requirement.
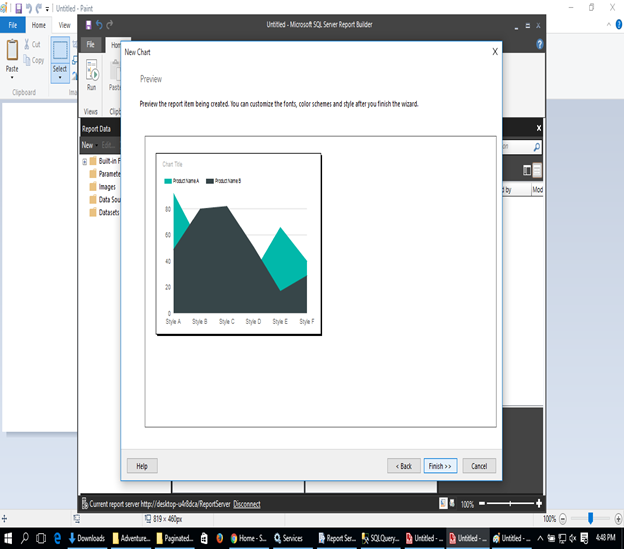
Preview
Once finished with “Arranging chart field”, users will redirect to preview section.
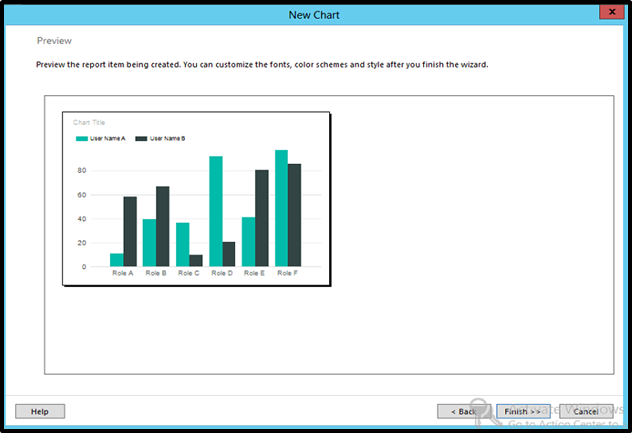
Once finish, users will able to see chart design in Report Builder
Run the report
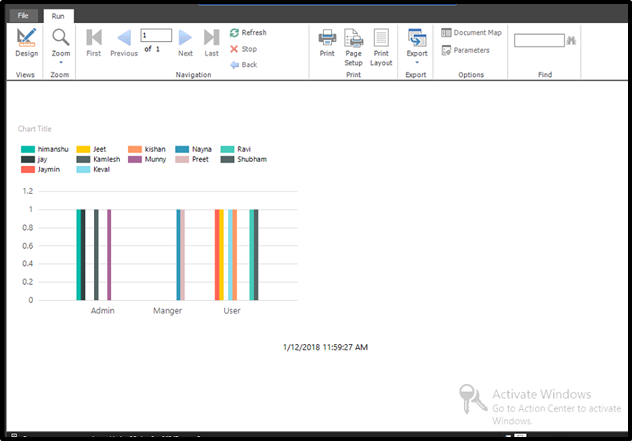
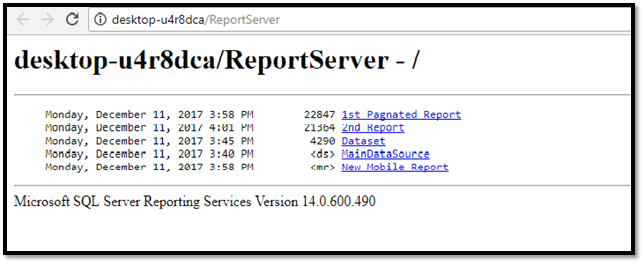
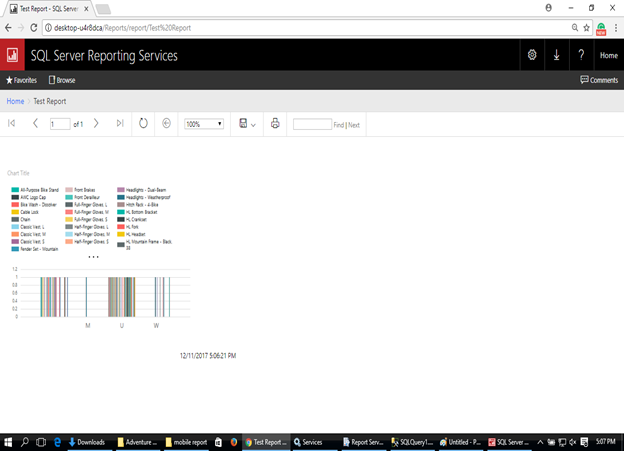
Check the report in Report Server URL
Users also able to see the report in “Report Server URL” and run the same.
Integrating the SSRS report with SharePoint 2016
Native mode comes with a pair of web parts that allow SSRS web parts to embedded into a SharePoint page.
Administrator can find RSWebparts.cab file for web parts from “C:\Program Files (x86) \Microsoft SQL Server\130\Tools\Reporting Services\SharePoint“
Copy this file from SQL to SharePoint farm and install the same
Install-SPWebPartPack -LiteralPath “H:\Himanshu\RSWebParts.cab” -GlobalInstall
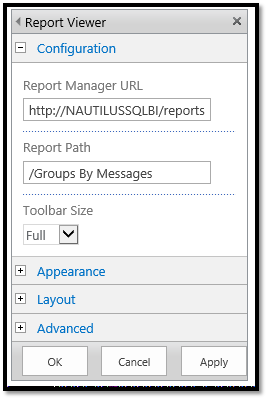
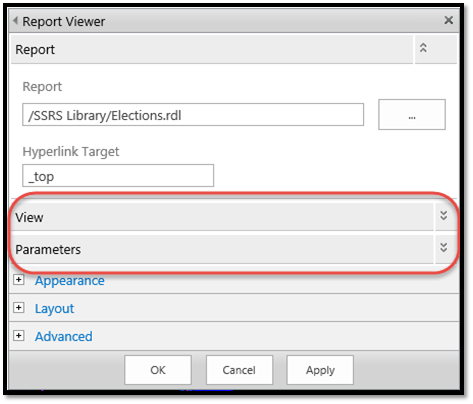
Use of the report viewer Web part
Once both web parts are installed “Report Viewer” and “Report Browser” will display under the miscellaneous section while new web part is added.
Report browser used to display the report in Server.
Report viewer used to render those report.
Use SQList to synch SharePoint data to SQL Server and report using SSRS2016/2017
Use SQList Product to export SharePoint Data into SQL
First of all, we are assuming you have installed license version of SQList on your computer.
Please follow below instruction to Export SharePoint data into SQL.
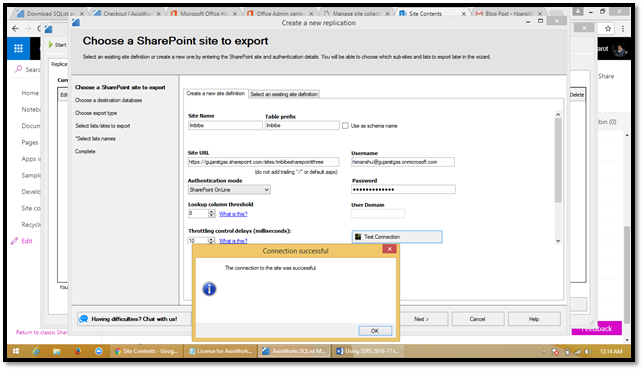
Choose a SharePoint site for export
You need to write Site Name, Table Prefix, Site URL, Authentication mode, Username and Password to establish the connection between SQList to SharePoint Portal.
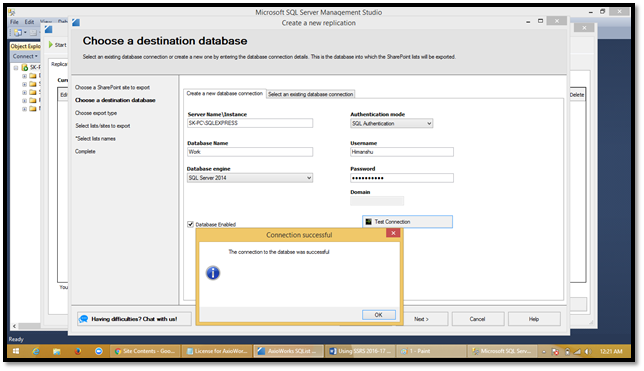
Choose a destination server
This section enables us to establish database connection which the SharePoint site will be exported.
You need to write SQL server name with an instance, Database Name, Database Engine, Authentication mode, Username and Password to establish SQL test connection.
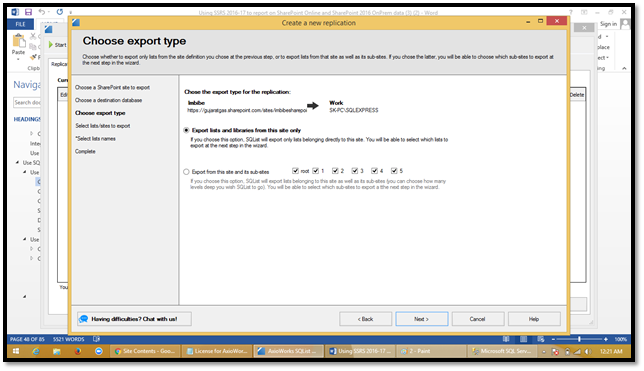
Choose export type
In this section, you need to choose an export type, you can choose Export List and library from this site only.
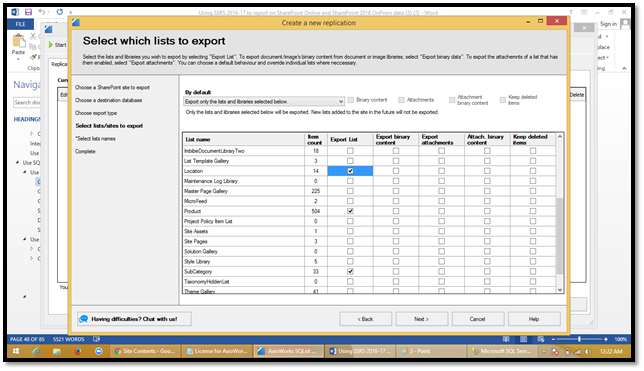
Select which list to export
In this section, you can select Particular list or library which you want to export from SharePoint to SQL.
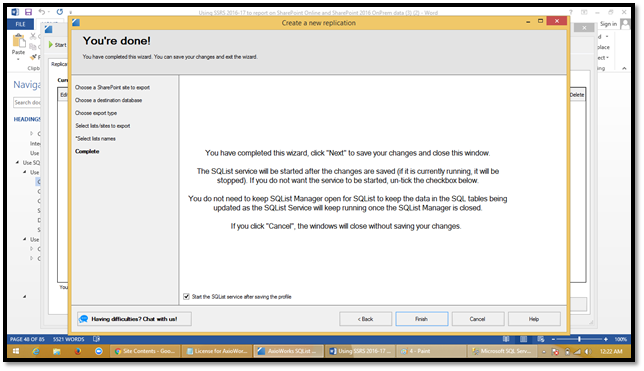
Done
This section confirms that all your changes have been completed, post-finish SQList service will be started.
SQList Service is running
This screen will be display post finish on the last screen, you need to click on refresh to check logs of events.
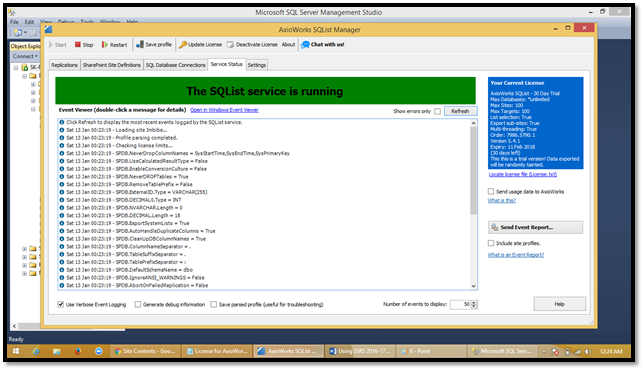
This section displays all details logs of export SharePoint data into SQL.

This SQL table display all your data successfully exported from SharePoint site to SQL Table.
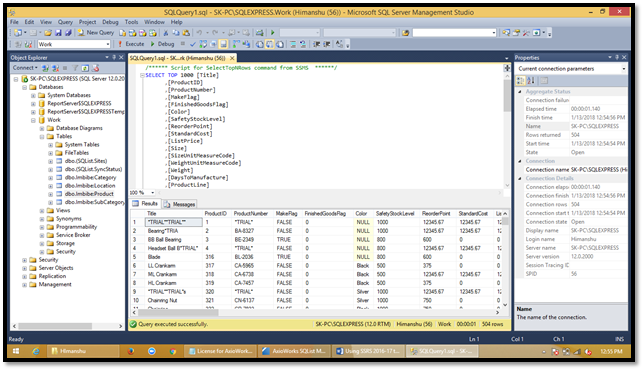
Now since data is exported into SQL, we shall use this data as Data source in SSRS and create Report
Use exported SQL data as Data source in SSRS and create reports
This section indicates how to use SQL Data as a data source and create SSRS Reports.
Configure reporting service using report server configuration manager
In order to host SSRS reports, Administrator needs to configure Reporting Service in the server where reporting service instance is installed.
Below are steps to properly configure Reporting Service on the server.
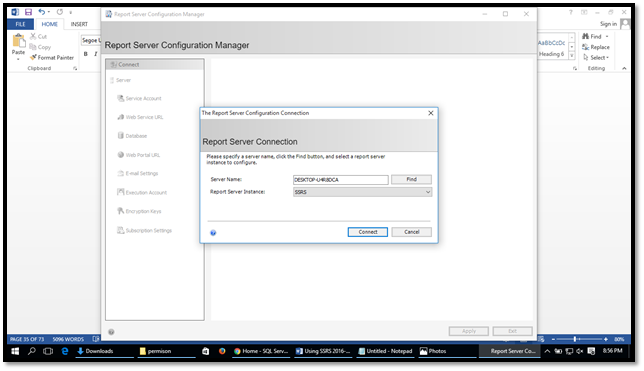
Report server configuration connection
When user open Reporting Service Configuration Manager, he/she will redirect to “Reporting Service Configuration Connection” screen.
In this Server name and Report Server Instance name populated automatically, users need to connect the same to establish the connection.
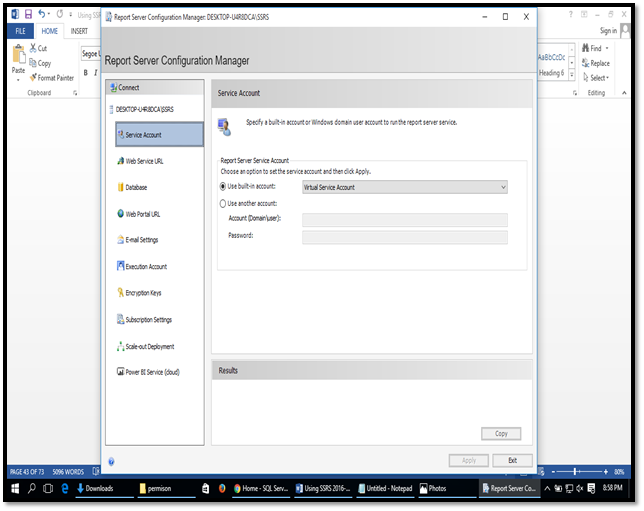
Service account
Once connected, the user will be redirected to Service Account Screen, in which User has rights to choose “Built-in Accounts” or any accounts with relevant authorization, a user will Sysadmin right will work.
After writing relevant credential, the user needs to click “Apply” button, to authenticate.
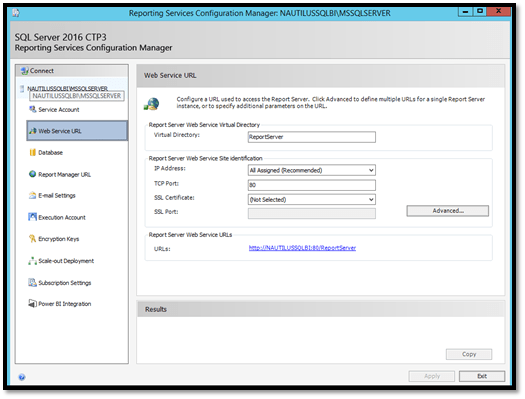
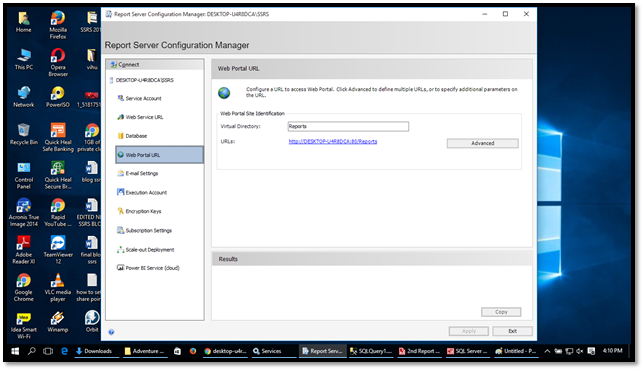
Web Service URL
This screen will help users to configure Web Service URL for Reporting Service. Default values will be auto-populated for each field, the user can update the same if required, after confirming all correct values, User needs to click “Apply” button to enable Web Service URL.
Note: If user faces any error while clicking on this URL, Kindly check reporting Database status.
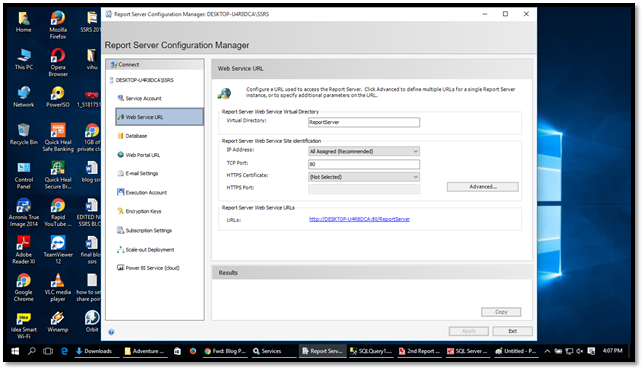
The User clicks the URL to given screenshot:-
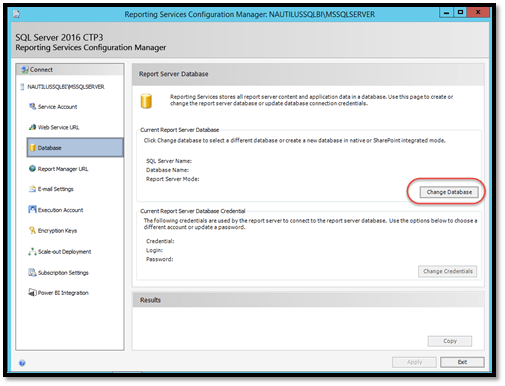
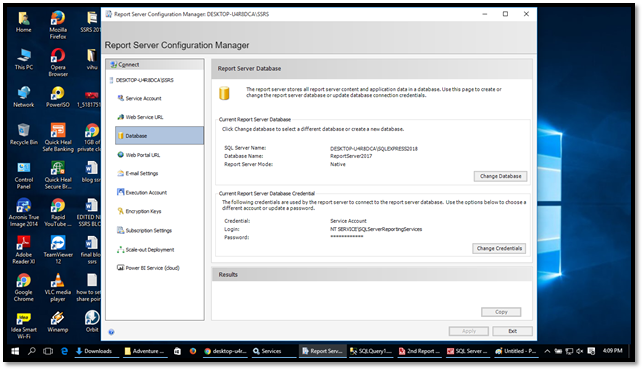
Database
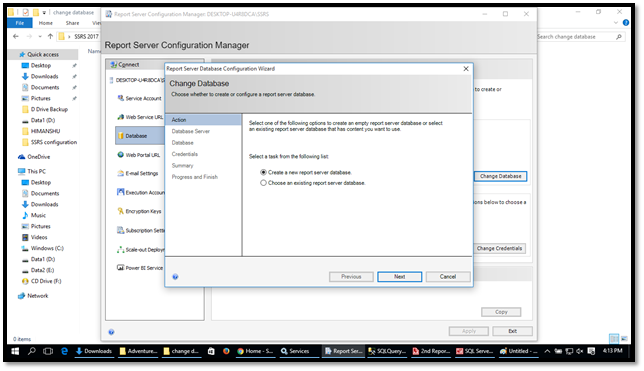
The user can create or change Reporting Server Database from this screen, if a user configures reporting service for the first time, he/she needs to click on “Change Database” button and create Reporting Server Databases.
Two databases will be created after this configuration.
- ReportServer
- ReportServerTempDB
Once all process has been done, press “Apply” button.
Database Creation
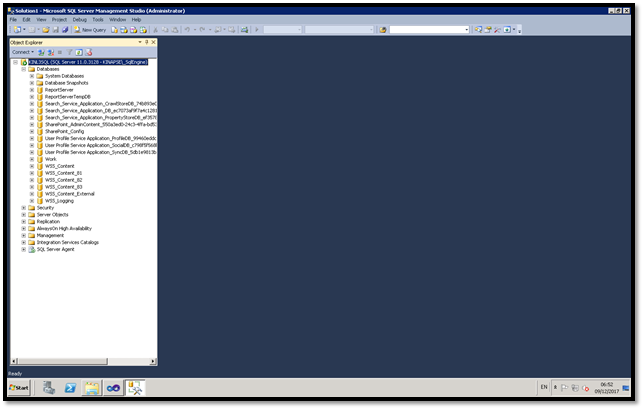
List of Databases
.
Report manager URL
The user needs to click “Apply” button to enable default “Report Manager URL”. Once its enable then user can able to click URL and will redirect to Report Manager URL
Report Server Manager Screen.
Create SSRS Report using Report Builder
Once SSRS Service properly configures, now it’s time to use Exported data and create Chart using Report Builder.
Choose project types
The developer can select any particular service Types to build SSRS Reports.
Add and configuration data source and configuration
Once the SSRS Configuration completed, A Developer needs to add the data source to the reports. It can be done using “NEW/ Data Source” property of Shared Data Sources.
In this screen, a user can write “Name of the Data Source“, select “Type” and Configure “Connection Strings“.
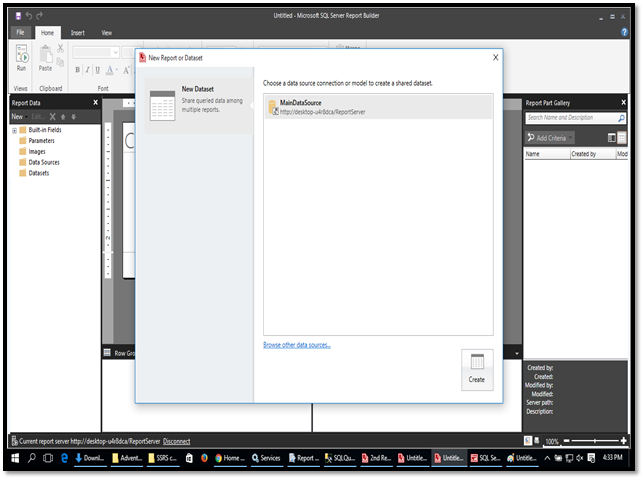
Add data set
The Developer creates Dataset using the Report Builder. It can be done using “NEW/ Data Set” to create and add dataset.
The developer needs to Data Source to create a dataset.
How to add data source to create new data set
Above the Screenshot, a click link “Browser other data sources” to add the Data source.
After the click link, the new page will be open, a new page screenshot given be below.
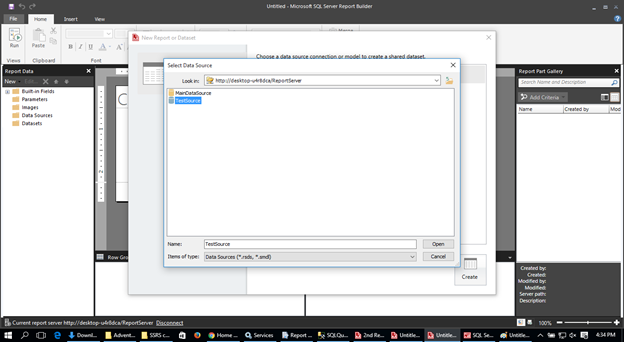
After the choose Data Source, the developer press an “Open” your data source is added.
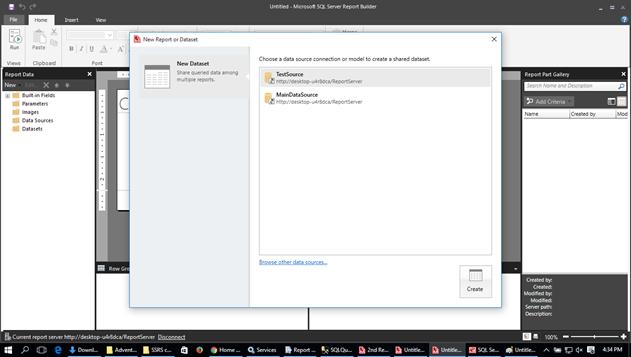
After click open, the below screenshot view your added data source.
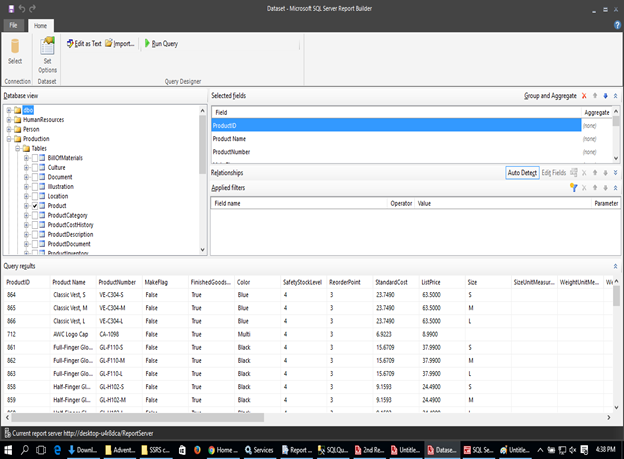
Query designer
The user can configure Query using Query Designer which will be used in Dataset.
Add reports
Once Dataset is ready, User can create the report using Dataset.
They are mainly two types of Report:-
- Paginated Report
- Mobile Report
How To Create Paginated Report
A data set will be created completely after a developer starts to create a paginated report.
The developer uses Report Builder to create a Report. A developer chooses the Paginated Report to create the below page opened.
Report Wizard
This is the very first screen after adding a new report, this screen information about how to configure Reports using Report Wizard.
Choose Data Set
This screen is display information about Shared Dataset, the user can select any shared dataset or can create the new data set one based on requirement.
Choose Chart Type
Here, the developer can choose a chart type, which displays your data.
They are mainly five type of chart type:-
- Column
- Bar
- Line
- Pie
- Area
Design the table
From this screen, User can decide, how the report will be generated, where the user has all the fields from Query and configures those fields in Pages if grouping functionality is required then the user can configure particular field into Groups sections.
Complete the wizard
After completing the design of table and press “Next“, the user can give the name of the reports and click “Finish” to complete report building procedure.
After click “Finish” the developer are also change font, schema, color, and style.
NOTE: – the developer saves the report in this section.
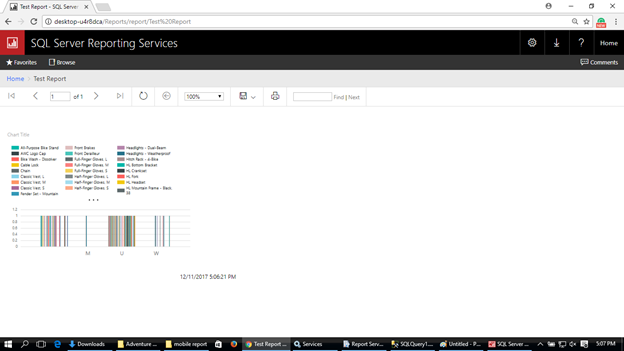
Paginated Report Output
Once finish, Report will be generated and the user can run the report also see the preview of this report from “Preview” section in SQL server reporting service.
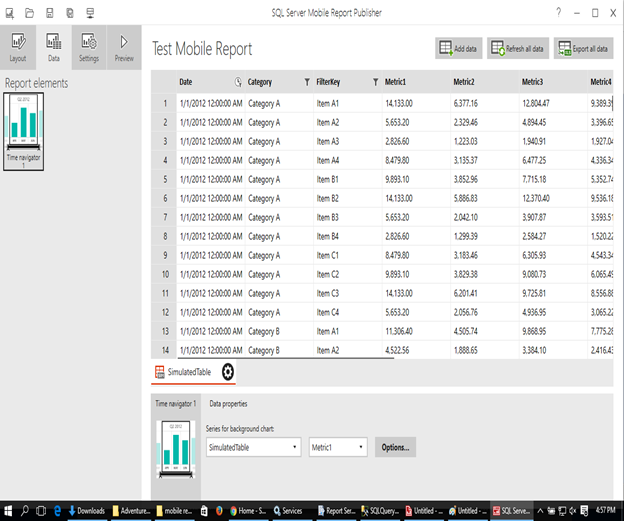
How to create Mobile Report
A Report Builder is also used to create a “Mobile Report“.
The developer also chooses the “NEW/Mobile Report” to create the Mobile Report.
After they choose the Mobile Report, the below page is displayed.
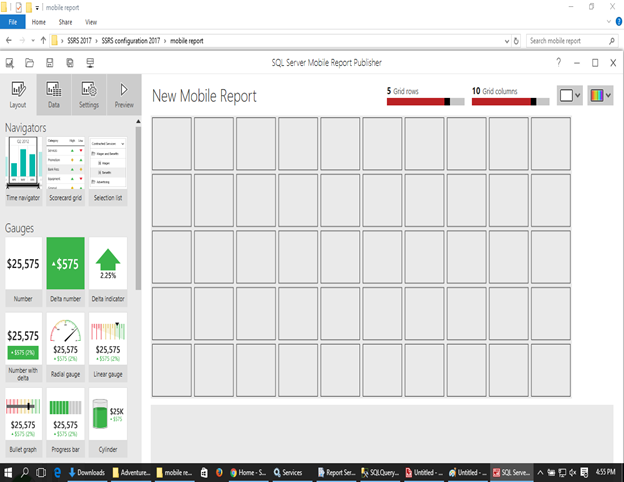
After the page Opened, The developer is select any type of Navigator, Gauges, like a developer
Drag and drop the item in given Block. The below page has displayed the navigator and gauges.
The Developer has also changed the report name.
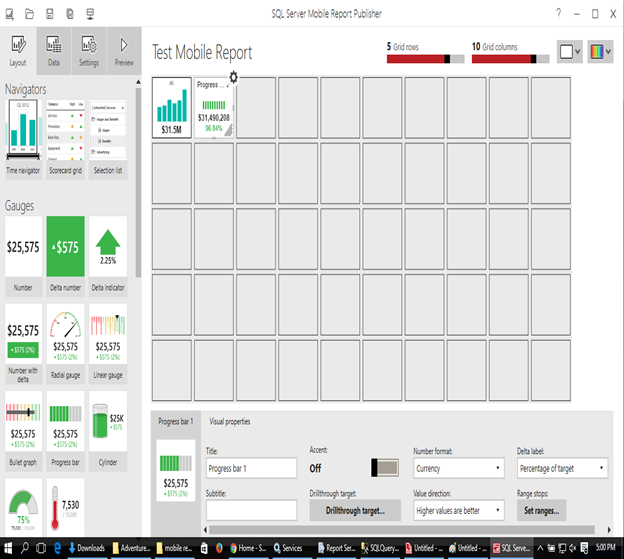
Report data
The report data is data view a Navigators and gauges. The Mobile Report
Import the data into the dataset. Below page display Mobile report data.
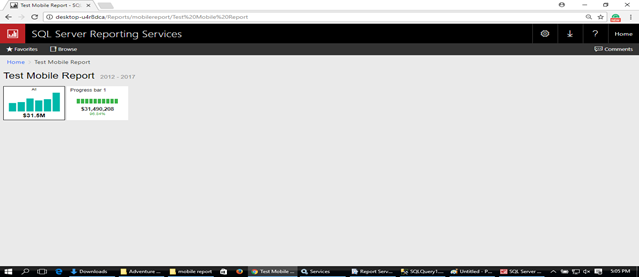
Mobile Report Output
In this section, the developer click the “Preview” to see the Mobile Report.
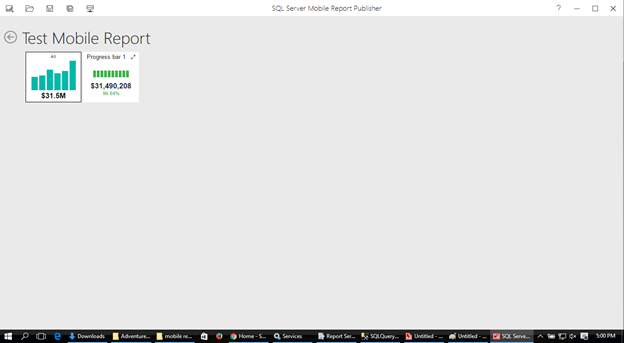
NOTE: – Save the Report in this section.
After, saving the report the Report is run on Reporting Service.
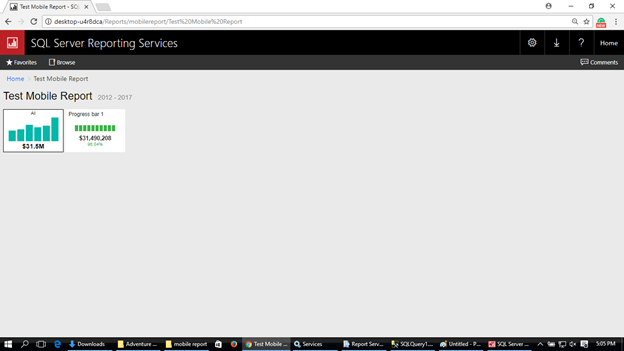
Published SSRS Report in Native Mode
Once Report is built, now it’s time to deploy the report to the Report server and configure permission so every user in the organization can review the reports from Report Server.
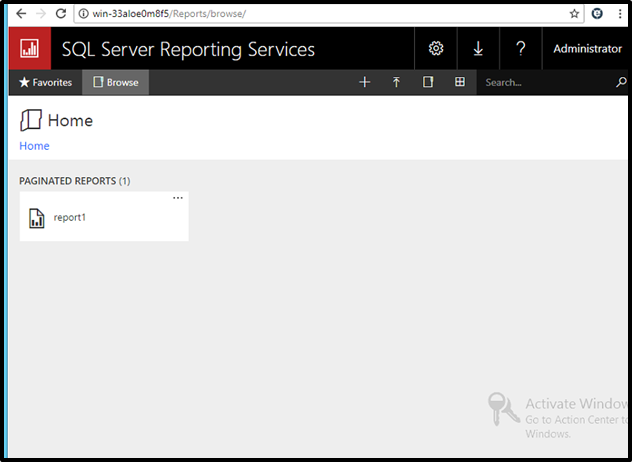
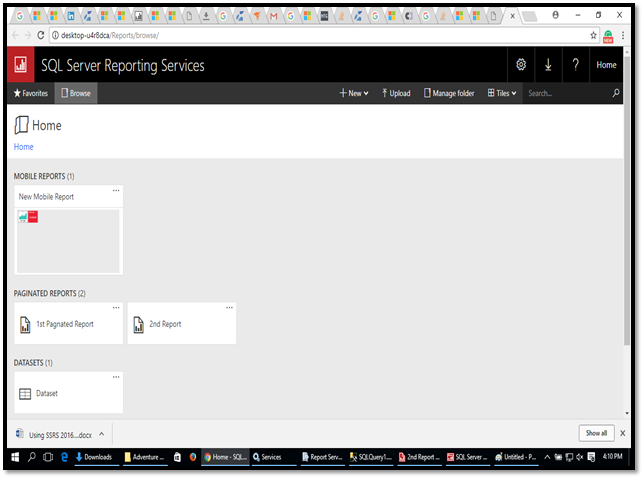
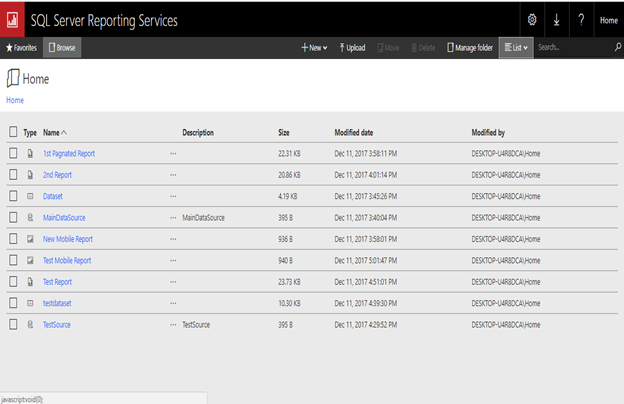
Report manager page after and publish reports
User needs to Save the report in Report Server, once user publish the Reports, Report Manager will be looked like this.
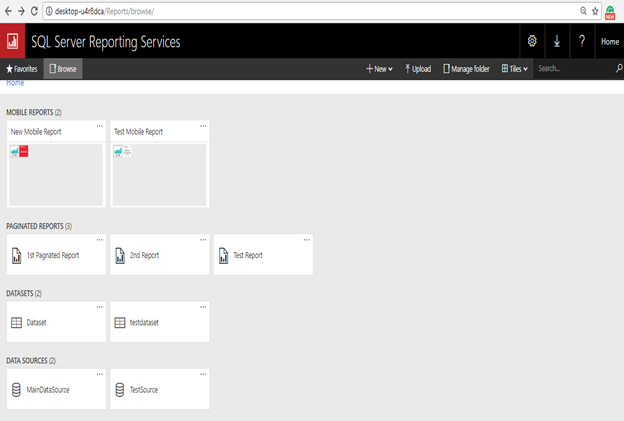
List of reports
Run the report on Report Server
The user can run any report from “Report List” in Report Manager.
Paginated Report Run on report server
Mobile Report Run on Report server
Setting the permission in Report Manager
Report Manager provides facility to manage permission of any folders, Datasets, Data Source and reports.
Follow the procedure to manage permission in Report Manager.
User clicks on “Manage Folder” from Report Manager Page.
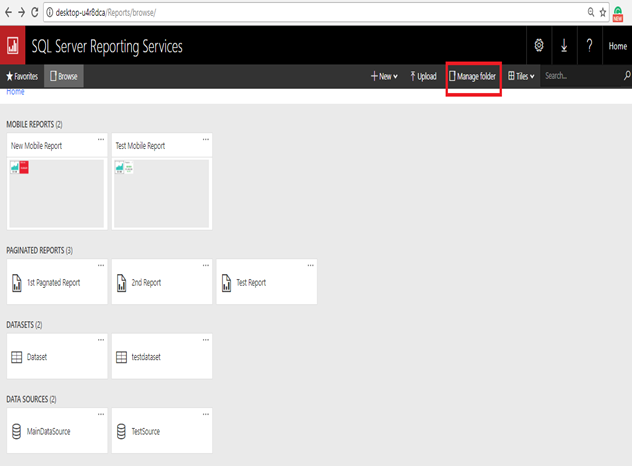
Once click on Manage Folder option, below page will be displayed where user can select “Security“
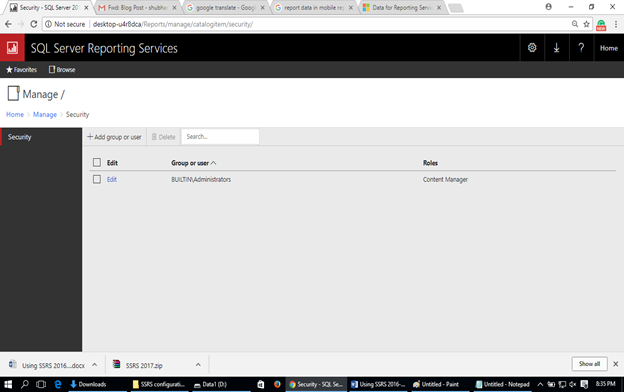
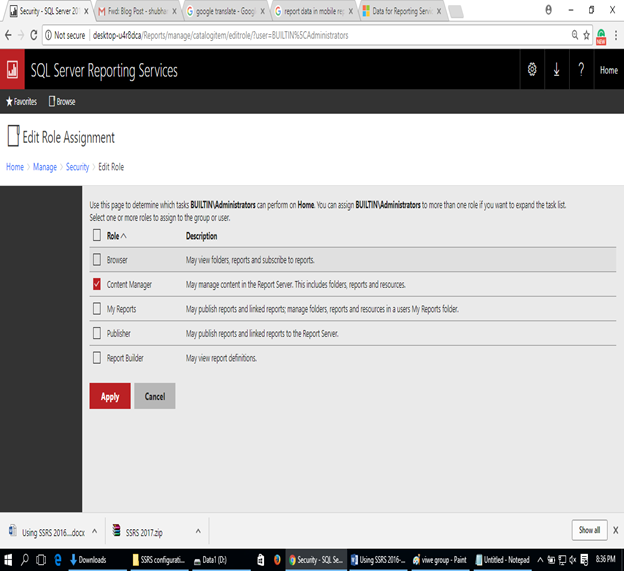
This is by default security group, the user can click on “Edit ” option to edit the permission.
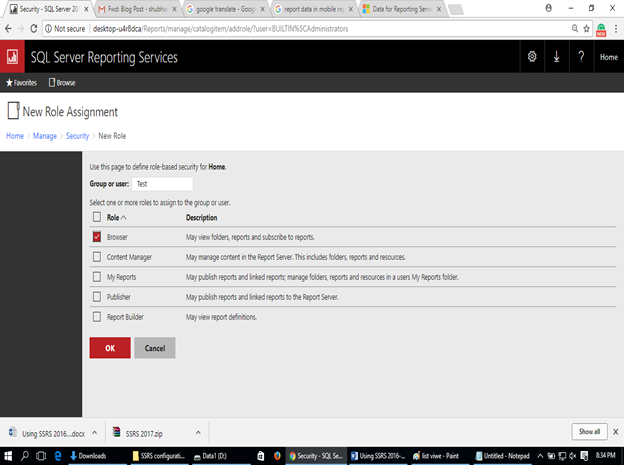
The user can write Group name and Username and select particular types of roles.
Displaying SQL Server Reporting Services Reports in SharePoint Online pages
The lack of out of the box support for SQL Server Reporting Services with Office365 has left a gap in functionality for organisations who need to utilise paginated reports against their data.
We’ve put together this blog post that explains how to make SQL Server Reporting Service (SSRS) reports available in SharePoint online as well as a simple way to build SSRS reports on SharePoint Online data.
It covers:
- Options for using SQL Server Reporting Services in the cloud
- How to display a SSRS report in a SharePoint Online page
- How to report on SharePoint Online data in SSRS and display in a SharePoint Online page.
READ NOW: Display SQL Server Reporting Services Reports in SharePoint Online