In this blog, I will show you the best way of creating a chart in Ms Excel on live data coming from SharePoint lists. We will start off by looking at the lists which we are going to use for this demo and followed by how we can use SQList to synchronize data between SharePoint Lists and SQL Server database and to finish things off, we will look at how to generate our reports and charts much faster.
Scenario Create a bar chart in Ms Excel which shows the total price and total current stock of products by Category Group. If you would rather watch a video, this tutorial is also available on our YouTube channel.
SharePoint Lists
For this demo, we will use three custom lists with some data in SharePoint.
Product list
- This list contains all the products data.
- Columns
- Title (Single Line of Text)
- Unit Price (Money)
- Current Stock (Number)
- Category ID (lookup column linked to category list).
Category List
- It is a custom list which contains data of all the product categories.
- Columns
- Title (Single Line of Text)
- Category group ID (lookup column linked to Category groups list).
Category Group List
- It is a custom list which contains data of all the product category groups.
- Columns
- Title (Single Line of Text)
Step 1: Create a Database in SQL Server
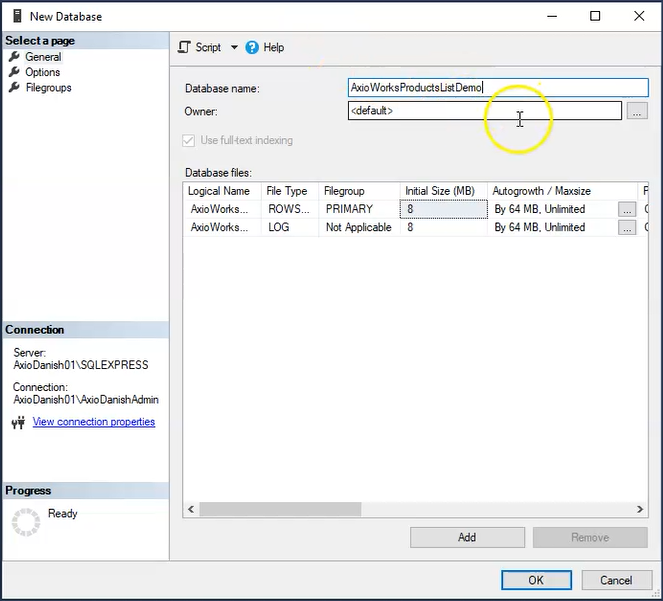
First off, we need a database that will be used for replicating the data coming from SharePoint lists.
- Open SQL Server Management Studio and create a new database named “ProductsReportdemo”.
Step 2: Replicate and synchronise data to database
Secondly, we need to replicate the data from SharePoint lists into SQL Server database. We will use SQList to achieve that.
- Open SQList Manager and click on “Create a new replication”.
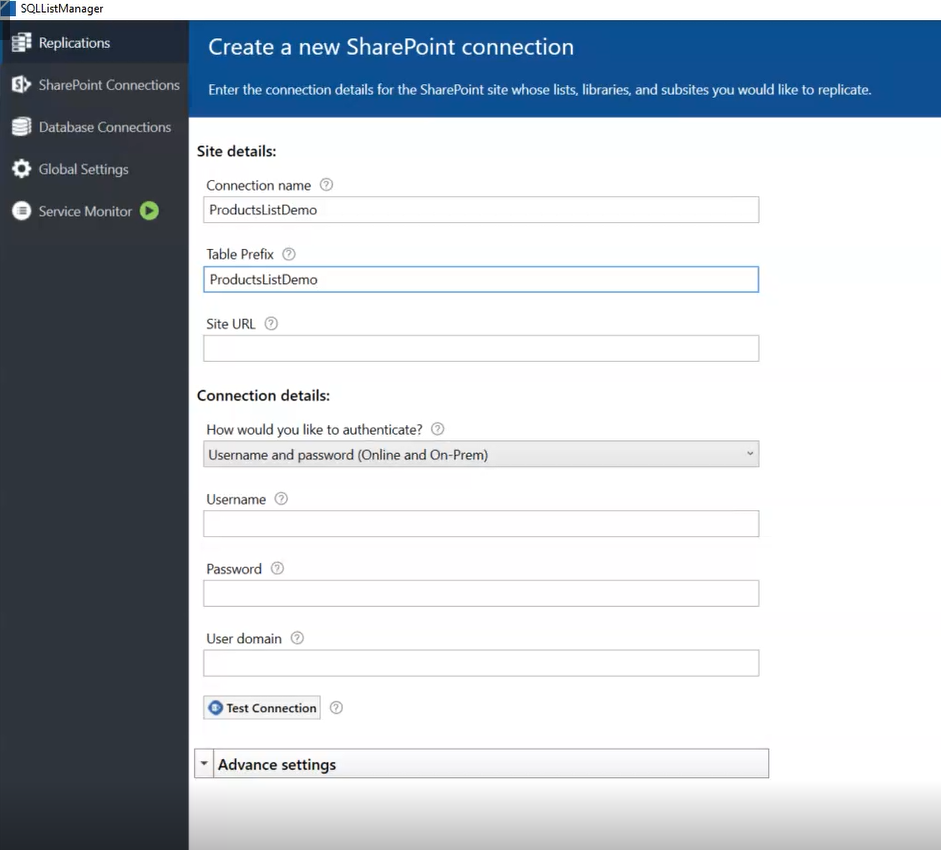
- Create a new SharePoint connection, enter the connection name and Table prefix
- and select the SharePoint site which contains the lists and clicks next.
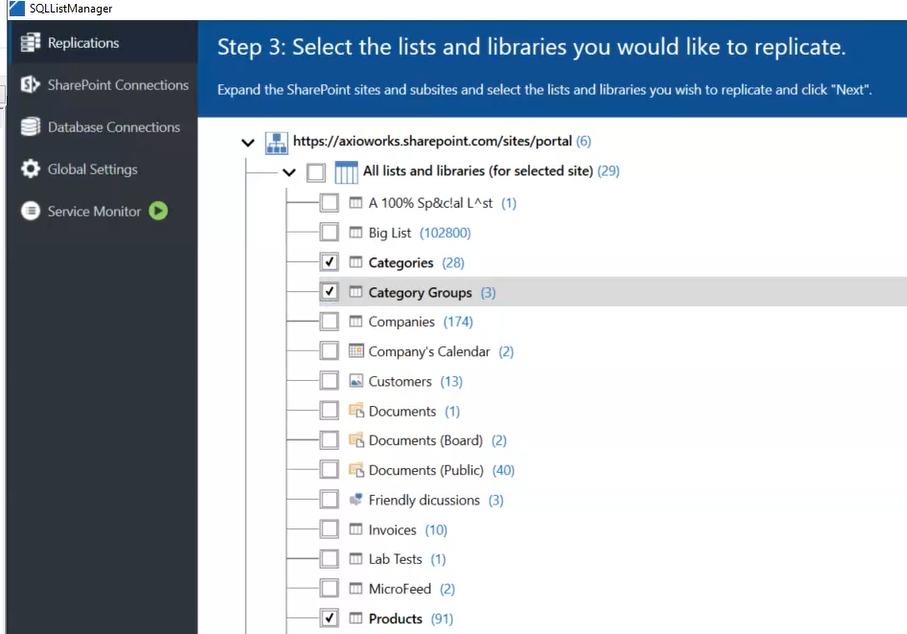
- Next step is to select the replication lists, we will select the 3 lists which are going to be used for this exercise i.e. Product, Category and Category Group.
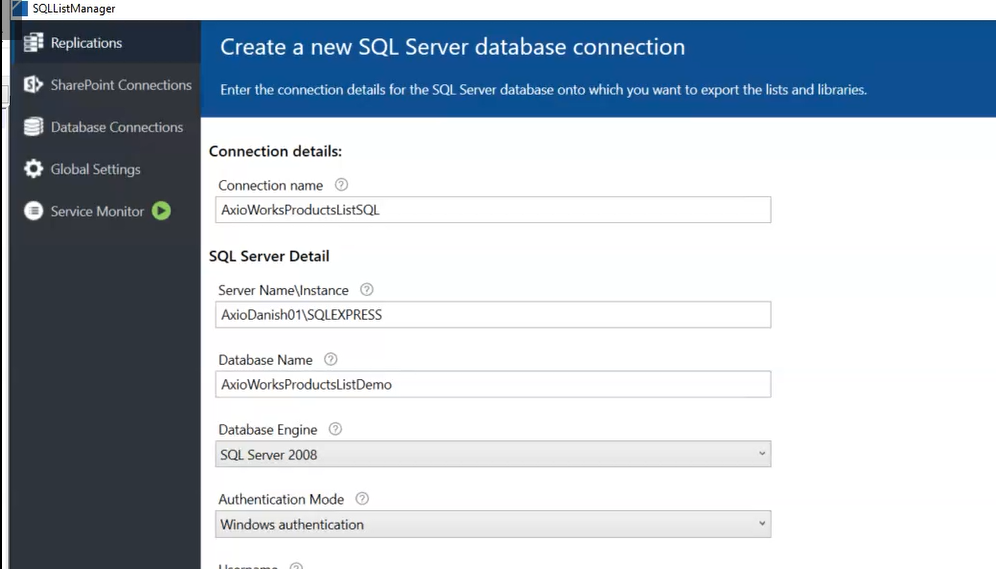
- Next, enter the details for the destination SQL database connection which is the database we created earlier.
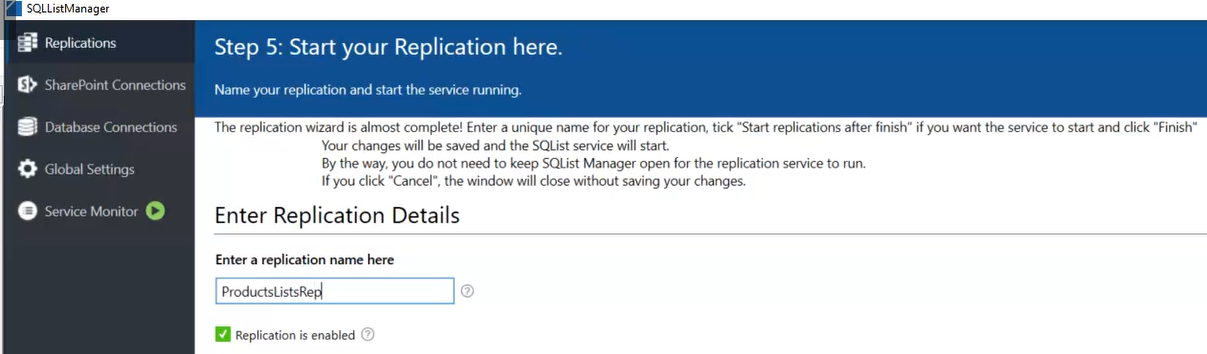
- Last step is to give this replication a name, and keep the default options as checked and then click finish.
- Once the replication is created, SQList replication service will start off for synchronizing the SharePoint lists and SQL database.
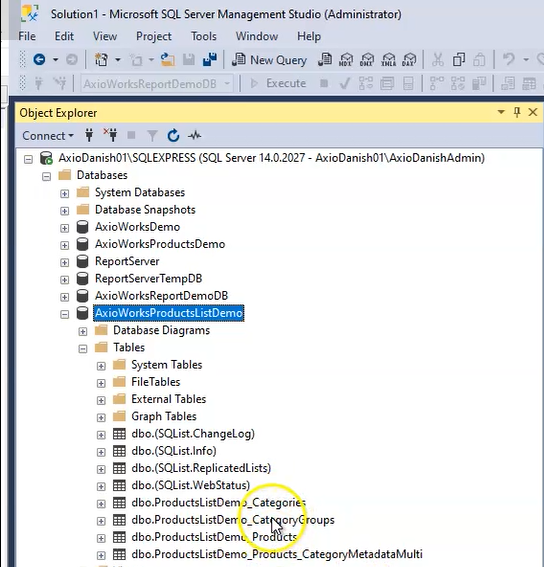
- Once the service is started, you will see that some tables have been created in the destination database including the tables for the lists which we selected.
Note: SQList will keep the database in-sync with the SharePoint lists which means any updates made in the lists will be replicated in this database as well.
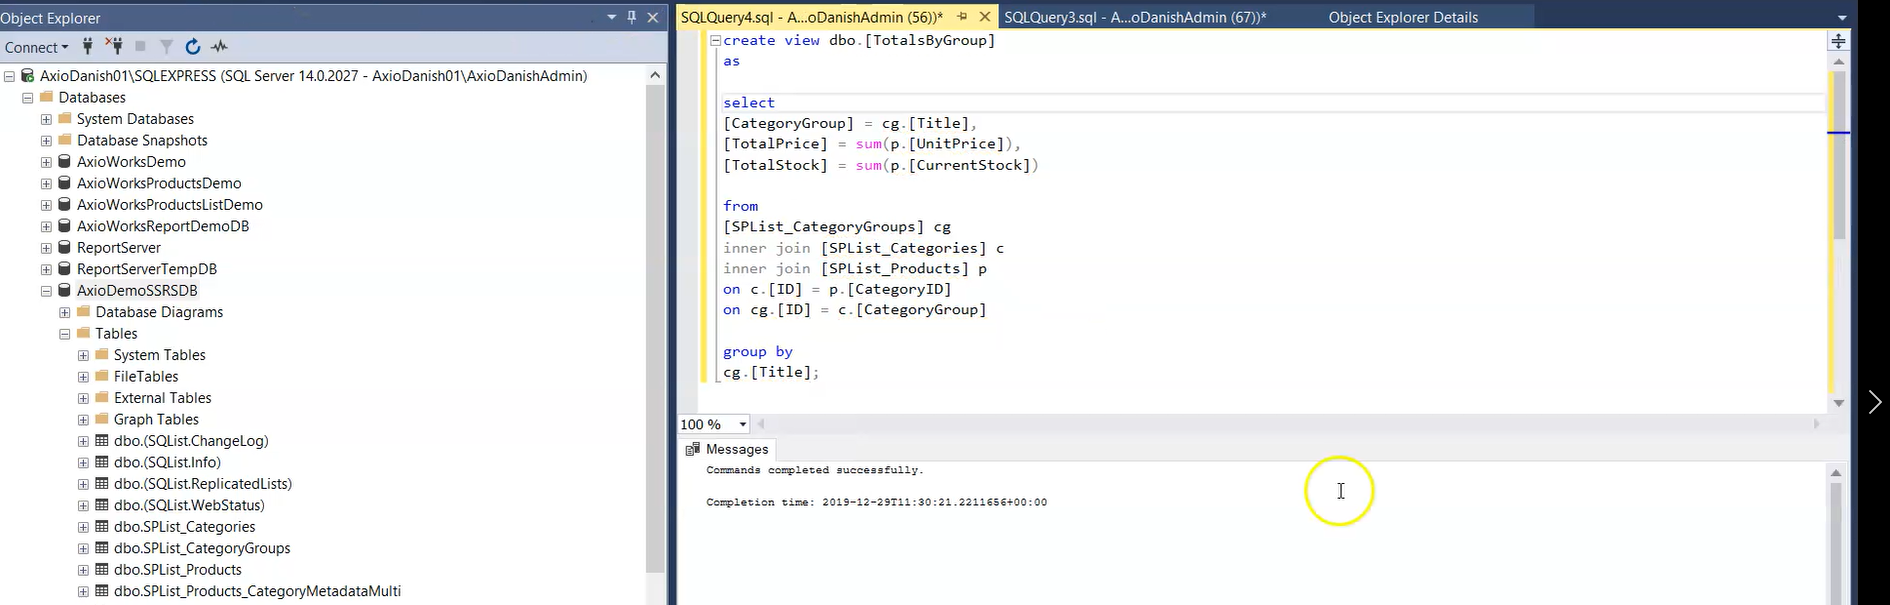
- In order to generate a report in the report builder, we will need a SQL view for the dataset.
- So, Let’s create a view that includes the Product category title, Sum of UnitPrice and Sum of CurrentStock from Product.
Step 3: Generate a chart in Excel
- Let’s open up Ms Excel.
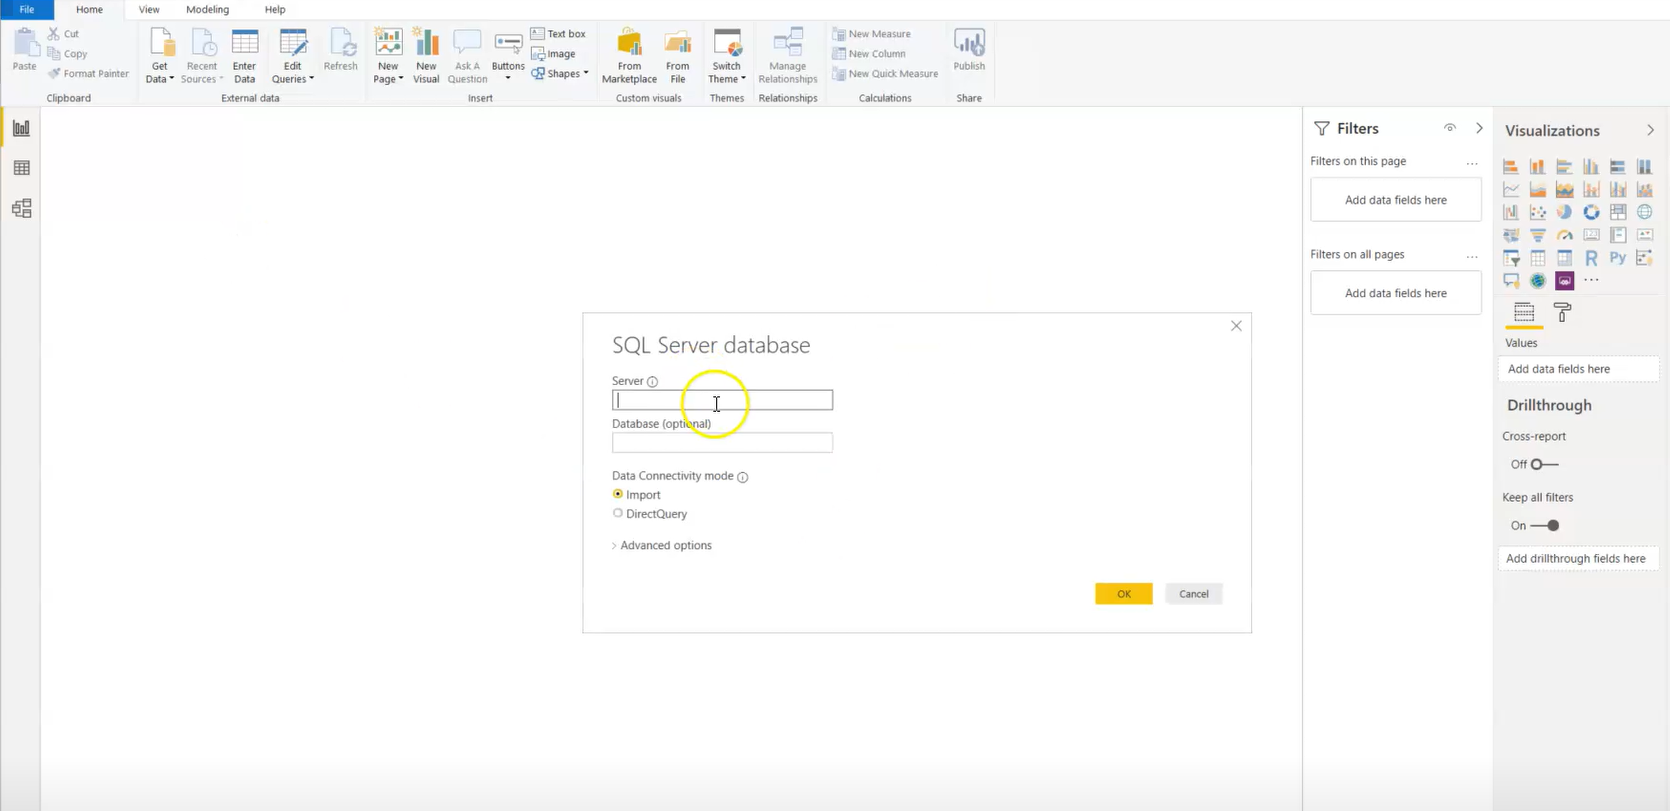
- Go to Data tab and click on Get Data and select From SQl Server Database.
- Enter the Server and Database name which we created for the demo
- This will open the data navigator, which shows all the tables and views.
- Select the SQL view “TotalByGroup” in the navigator.
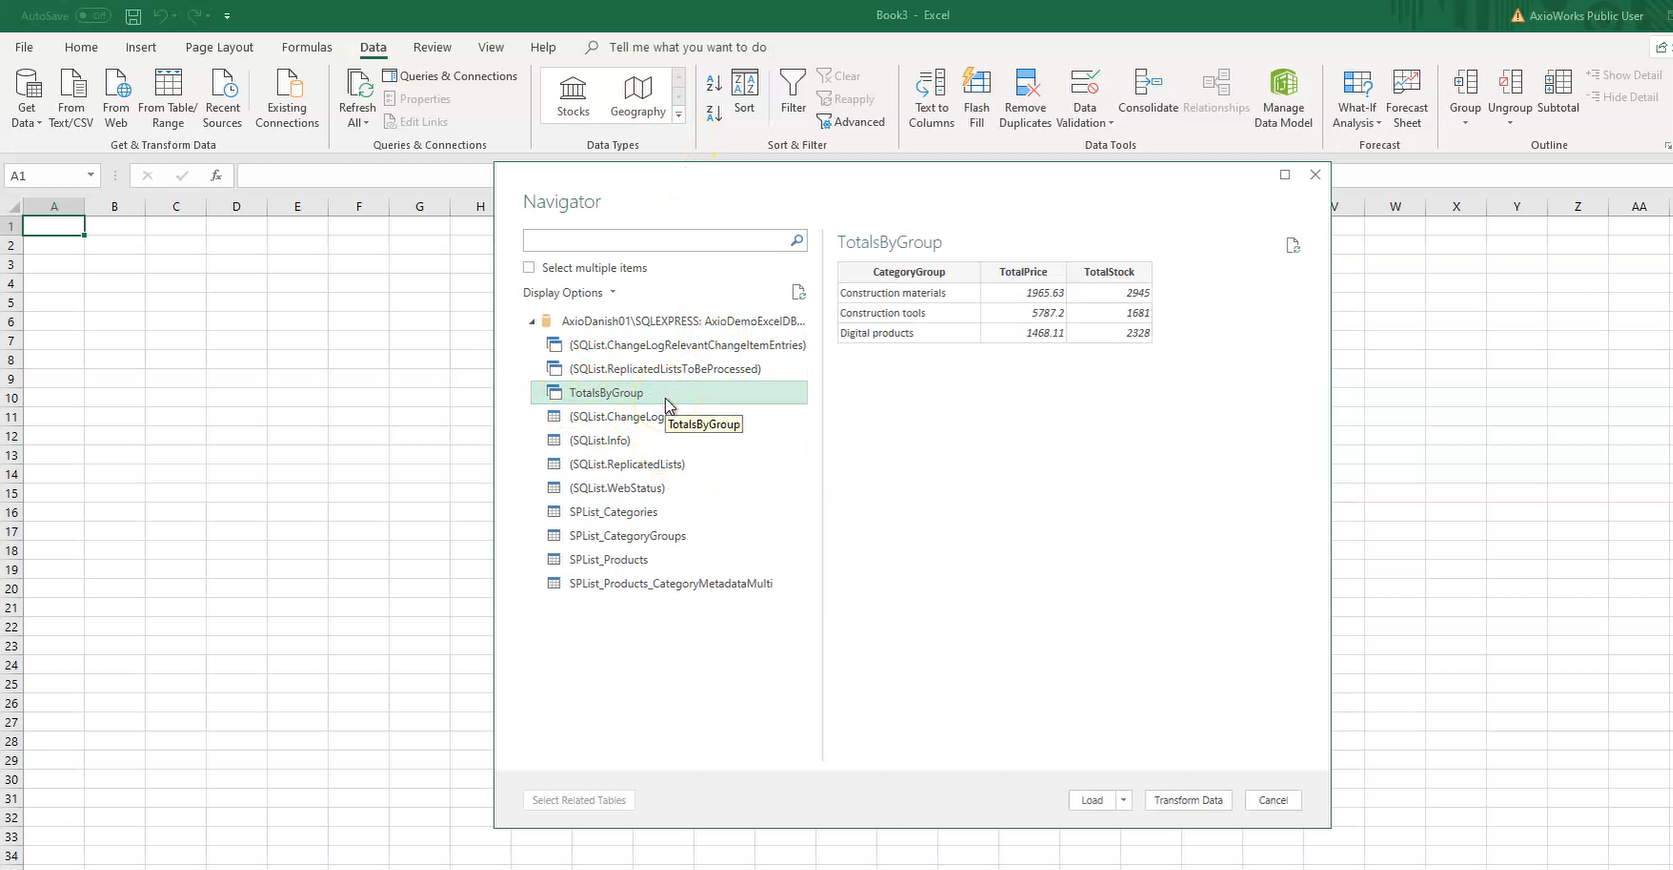
- Click on Load, this will load the data table in our Excel Sheet.
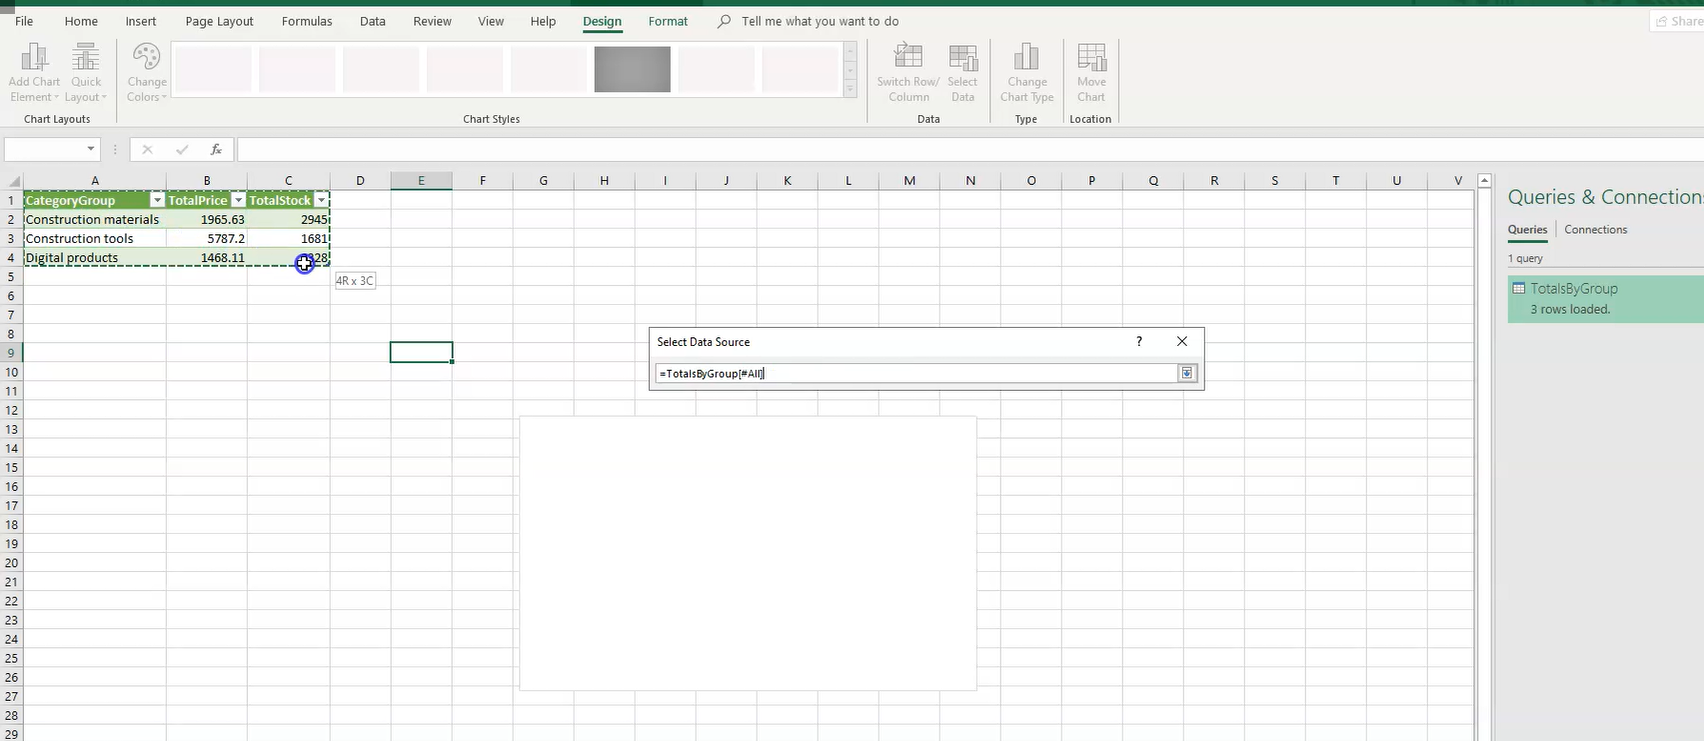
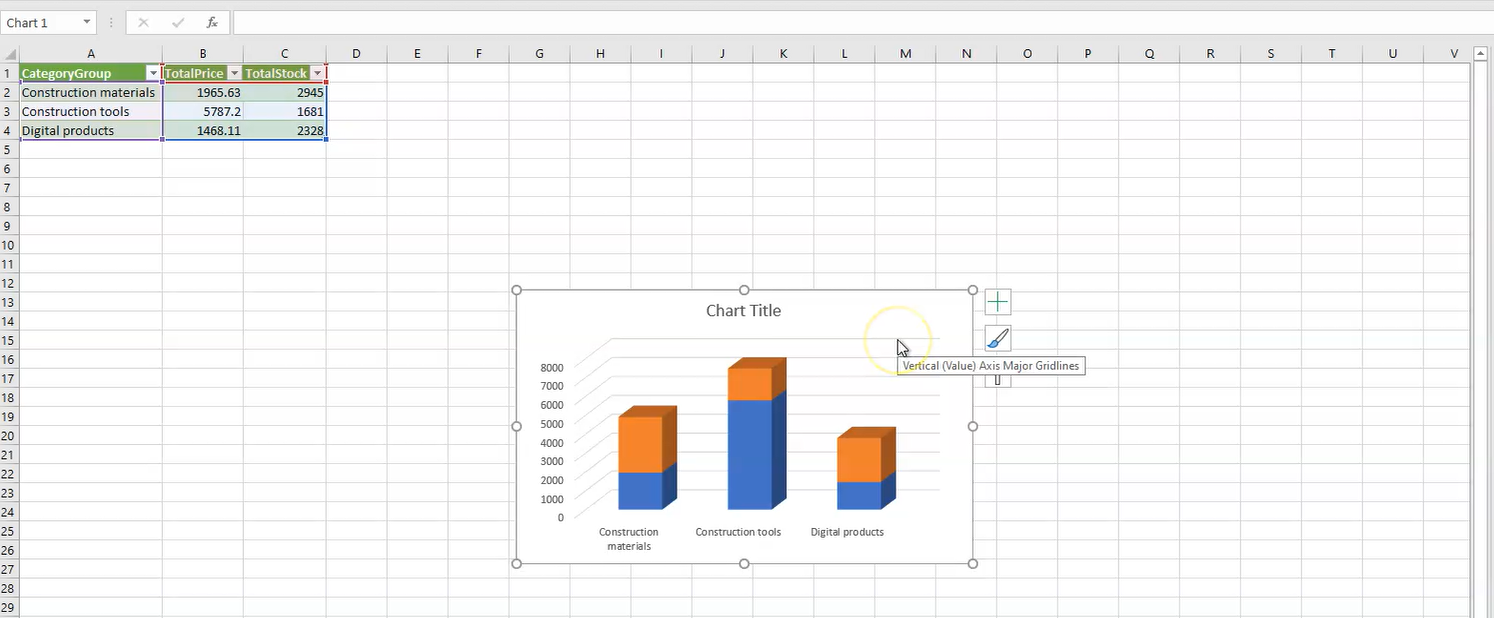
- Next step is to insert the report, so go to the insert tab and select the 3D bar chart from the Charts section.
- To select the data for the chart, click on Design Tab and then click on Select Data.
- Select the table which will populate the data source in the report.
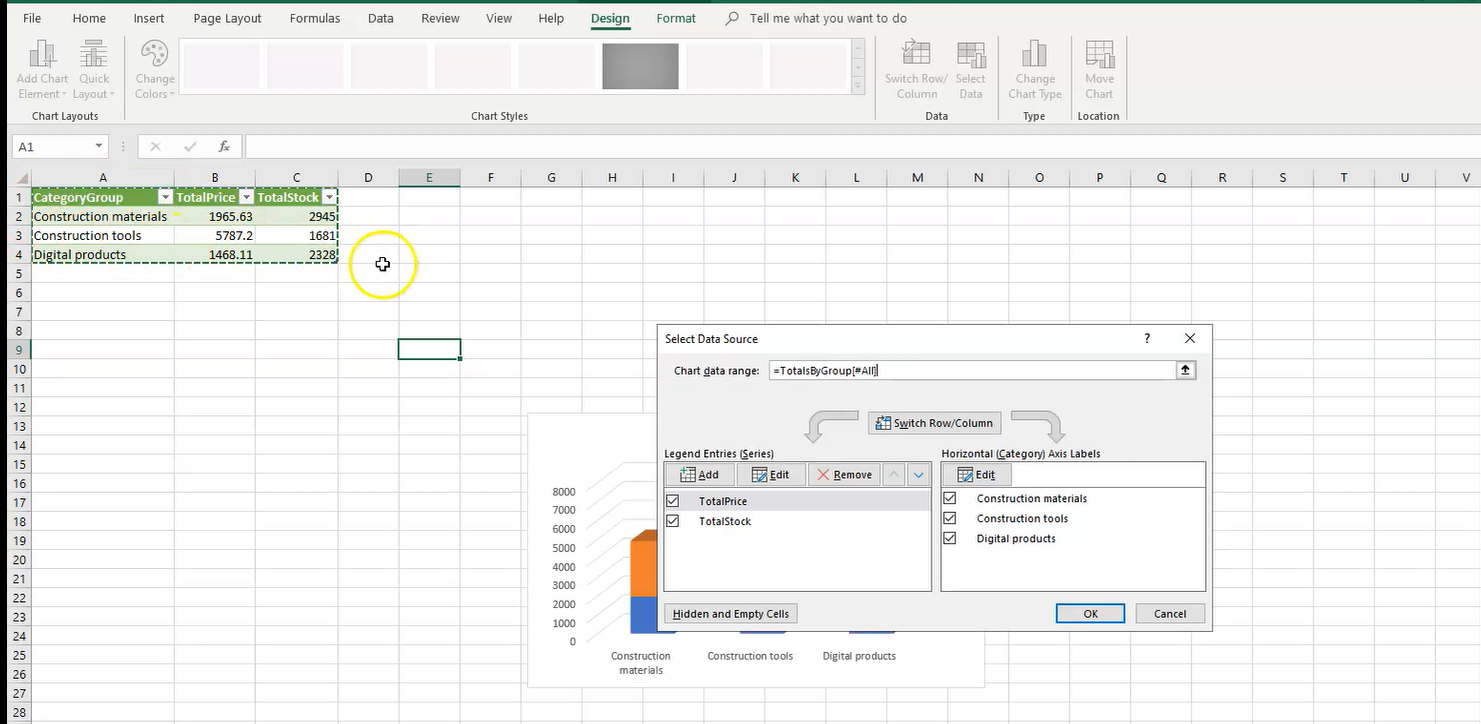
- This will populate the chart with the data we selected.
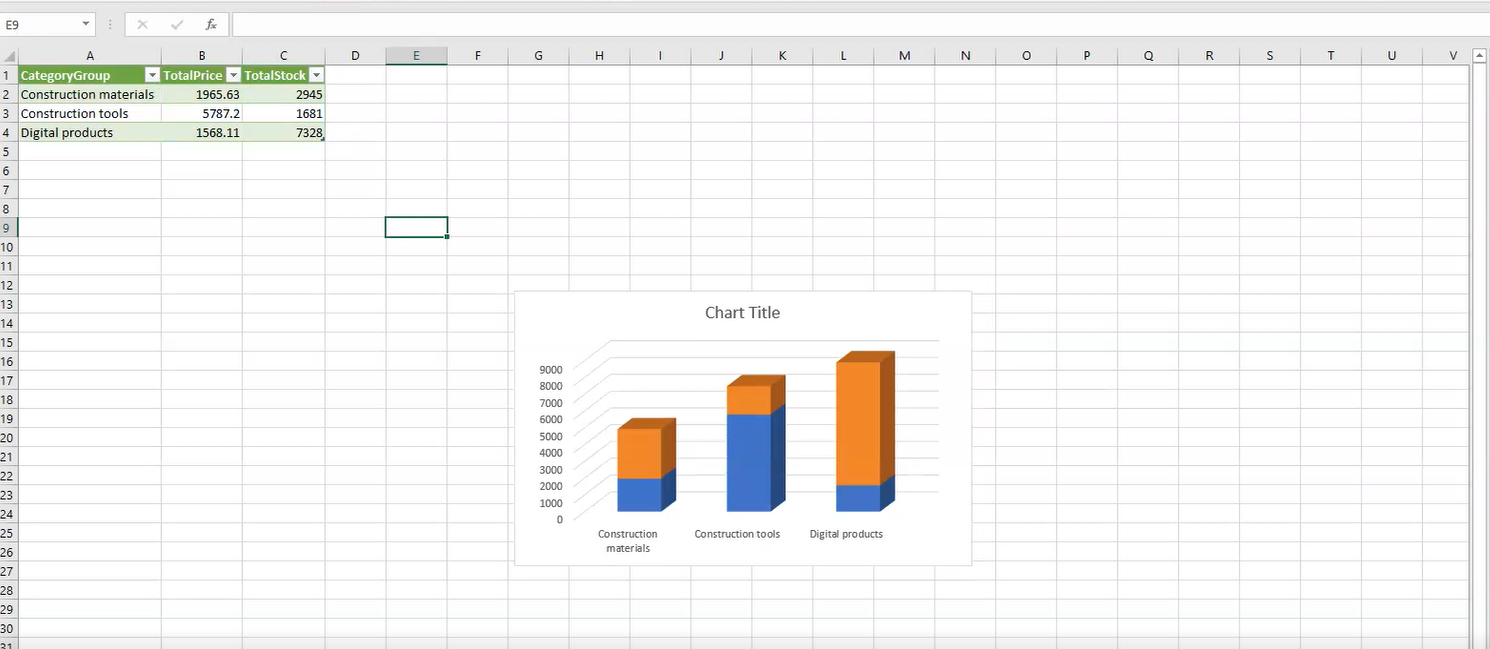
- Now to test the synchronisation, let’s go to SharePoint and add a new item in Products list. Lets add a product that belongs to Category Group “Digital Products” and set 2000 as stock. It will take few seconds to synchronise in our database, Once you refresh the report you will see that our data table and chart has been updated.
To summarise, today we saw how to generate a bar chart in Excel. We used SQList for replicating and synchronizing data coming from SharePoint lists so the chart reflects changes made to SharePoint Lists.