by Danish Ali Detho | O365 & Power Platform Solution Architect///
Troubleshooting and debugging are an integral part of building and supporting a resilient app especially when it is built using a low-code development platform because the logging information is not readily available to developers and requires some sort of admin access to retrieve it. This was a major issue for Power Apps especially when the app goes into the hands of users in order to make the troubleshooting of apps developer-friendly, Microsoft released a new feature called Monitor within the PowerApps Studio. In this blog, we will take a deeper look at Power Apps Monitor and how we can use it to troubleshoot issues with our canvas apps.
What is Power Apps Monitor?
PowerApps Monitor is a monitoring tool available with Power Apps Studio which provides App Makers the ability to view the logs which consist of a stream of network calls made from the canvas app in the form of events from a user’s session to diagnose and troubleshooting problems. App makers cans use it to make their apps more efficient by looking at the number of calls being made to the data source and potentially removing any unnecessary calls. We can trace events as they occur in a canvas app during the authoring experience in Power Apps Studio. Monitor also helps to troubleshoot published apps during runtime in order to fix any errors. Makers of model-driven apps can monitor page navigation, command executions, form-related issues, and other major actions to understand app behaviour and make improvements.
Different modes of Monitoring PowerApps
Monitoring App during Development
Sign in to Power Apps, Create a new app, or edit an existing app, and then On the left pane select Advanced tools -> Open monitor.
This will open PowerApps Monitor in a new browser tab and connects it to you’re running App session.
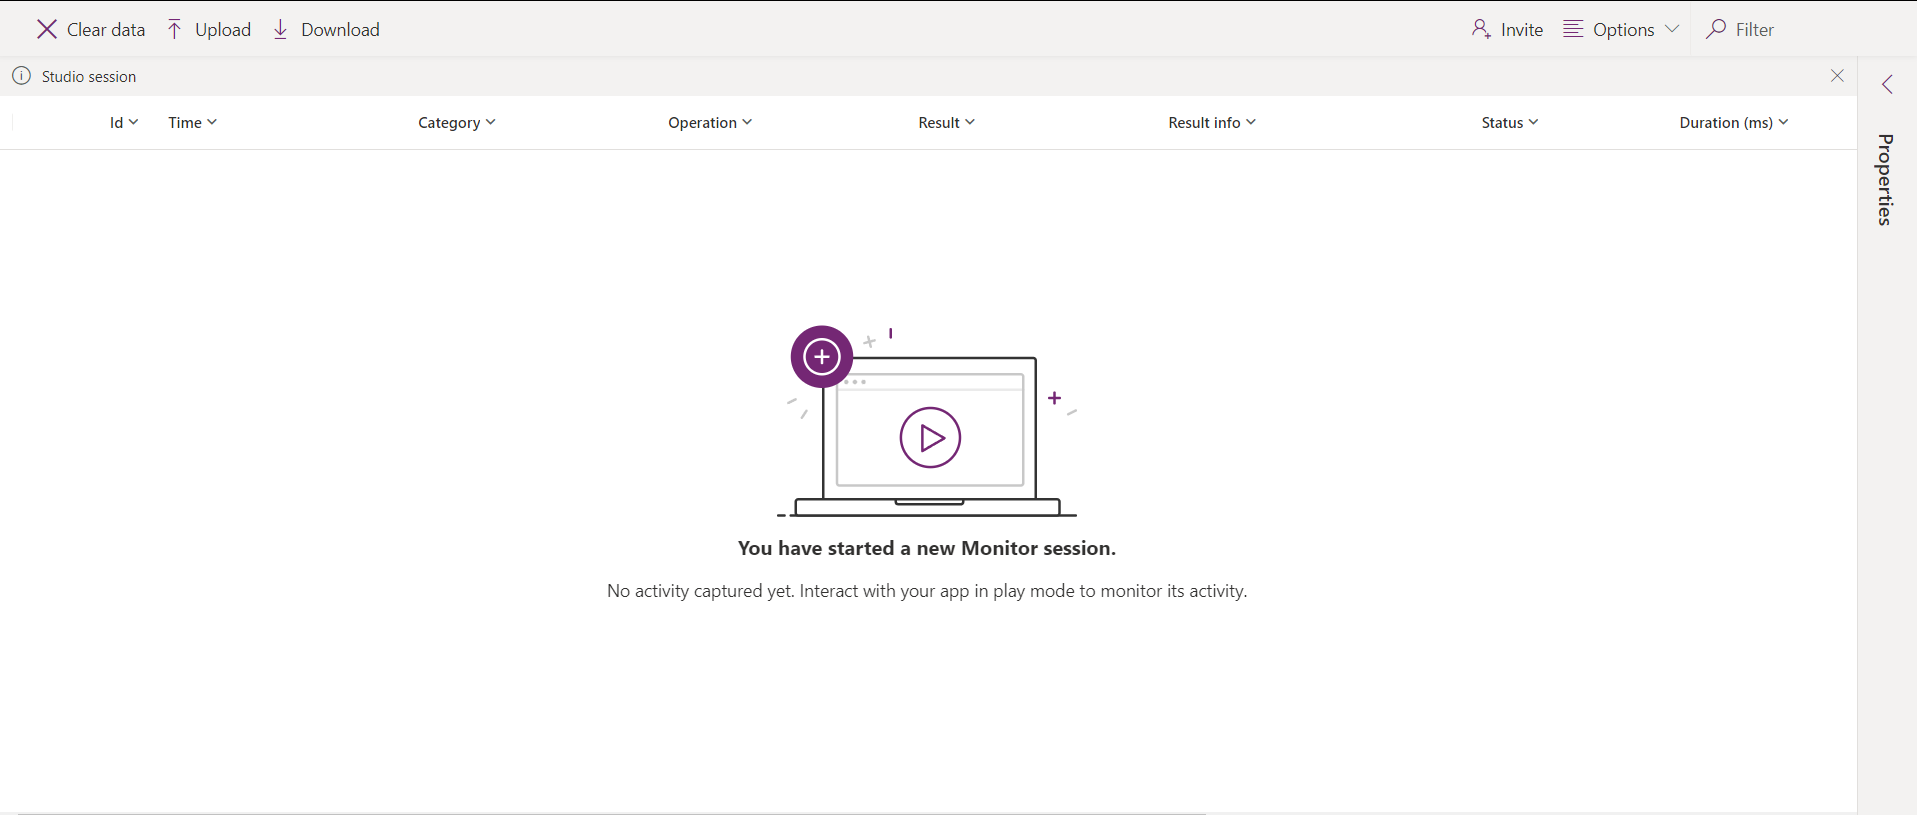
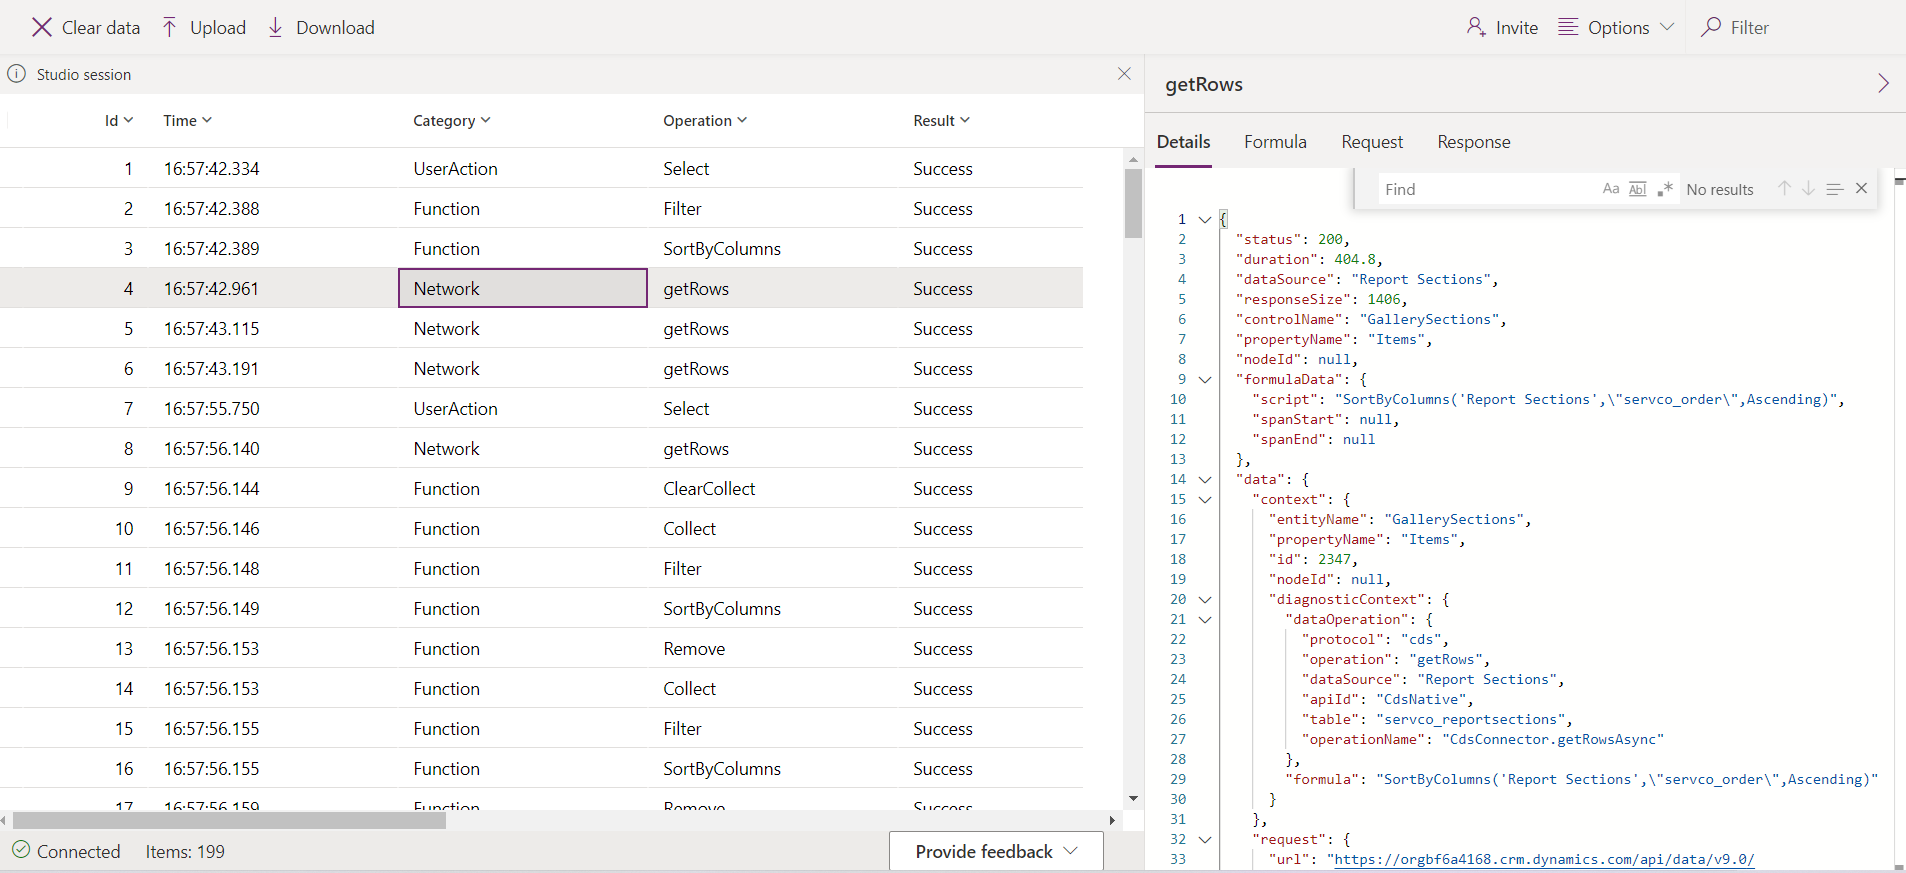
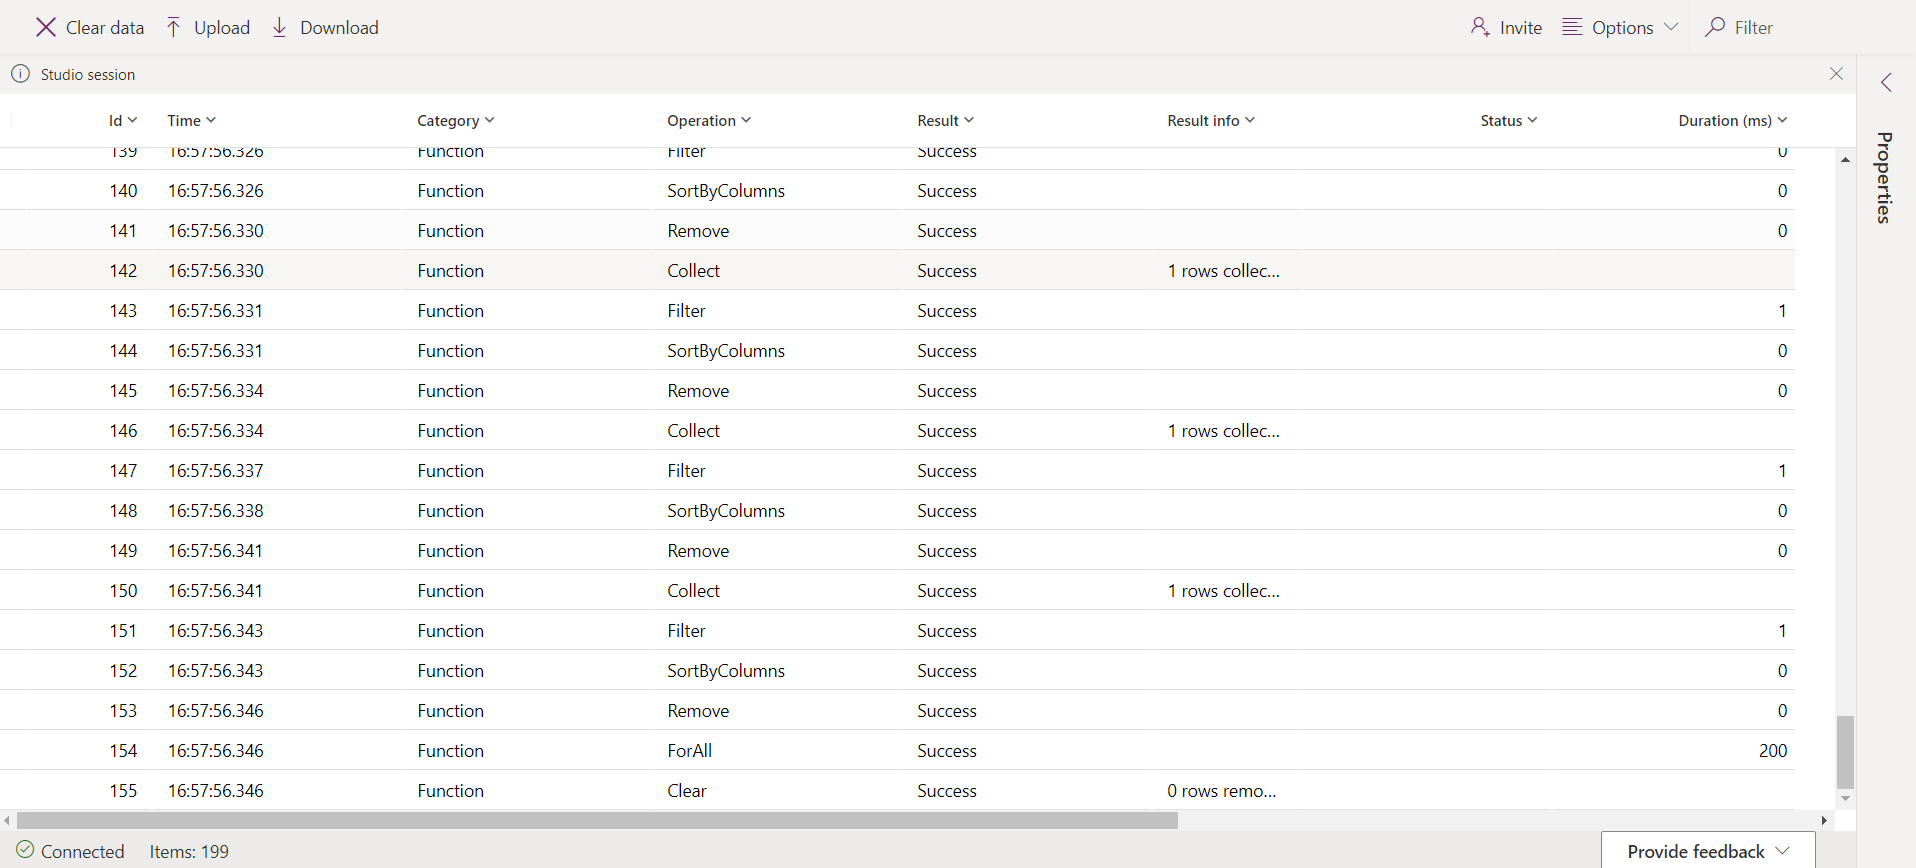
Once the monitor is open, you can go back to the App and then Play the App. Once you perform some actions within the app, you will see the monitor will be populated by a stream of events. You can review various properties for each event inside Monitor. Depending on the event category, some of these properties might not contain data. You can also download the events listed in Supported events for offline analysis. Events can be downloaded in .json or .csv format, and you can share them with others as well.
Monitoring App after publish
Sign in to Power Apps and click on the left pane, select Apps. Select an app from the list and then select Monitor from the menu or from the ribbon on top.
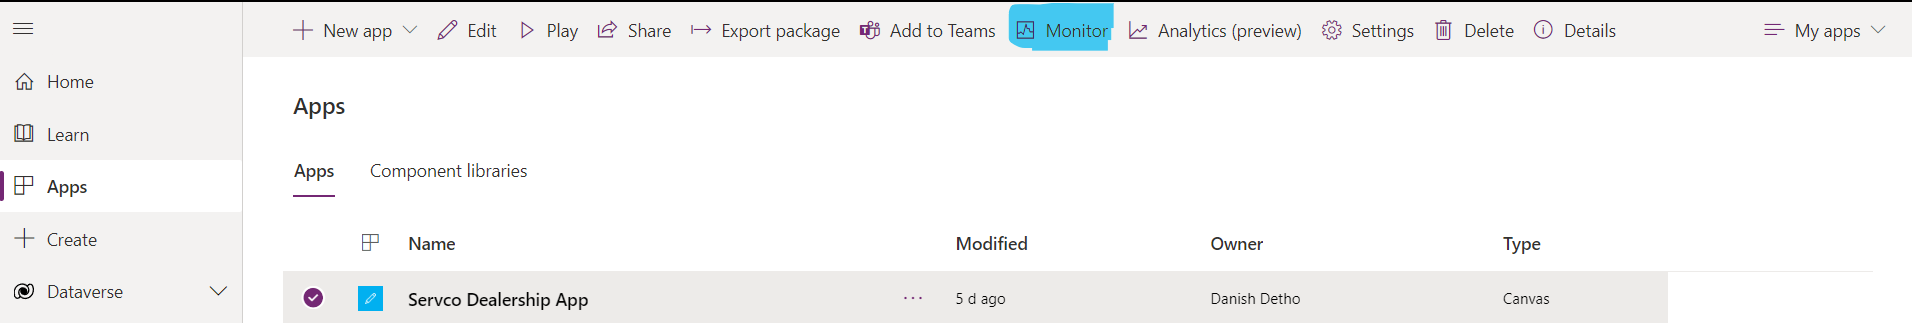
Once you Play the published app it will open the app in a new browser tab and connects it to the PowerApps0 Monitor. You’ll immediately see events in Monitor when the app is loaded in the web player, and as you interact with the published app.
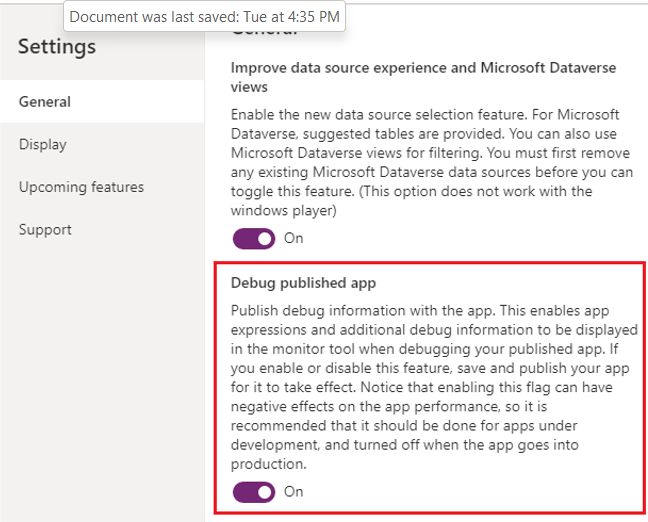
 In order to go deeper into debugging and view the expressions in Monitor for the published app, we need to turn on the setting to publish the expressions with the app. To enable this setting, go to File > Settings, and then turn on Debug published app.
Troubleshooting user sessions
An error can often be user-specific as well in which case you will need to monitor a User’s session to further troubleshoot. Monitor offers two features for troubleshooting and debugging problems in Power Apps via User Session:
Collaborate with user to Monitor via invite user
This enables developers to invite users within the same organization and share a monitoring session with them. When you invite others to participate in a session, they see the exact same app events in their own browser without having to open the app or reproduce the specific scenario that you’re debugging
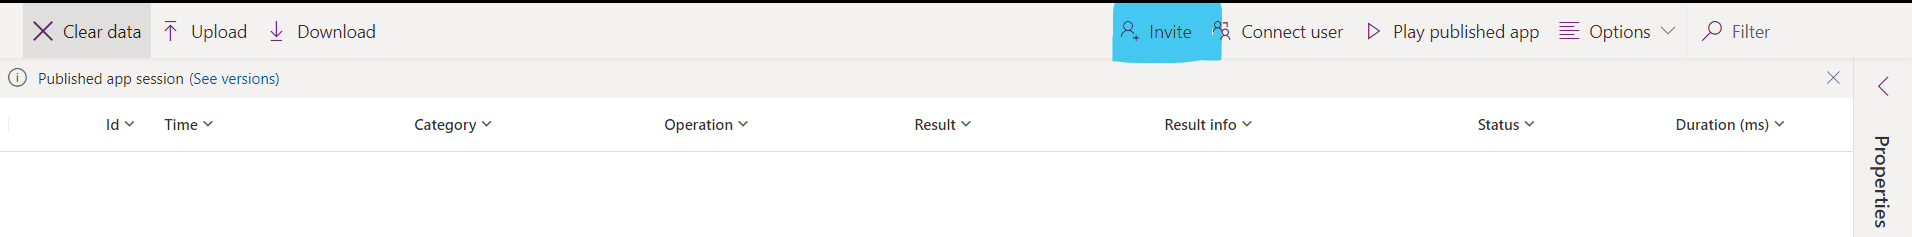
Collaborate with user to Monitor via connect user
This enables developers to share a link with users within the same organisation to open a published app and connect it to a Monitor session so that they can watch the sequence of events generated by the user’s interaction.
Power Apps Monitor enables developers to diagnose and troubleshoot problems faster, and build more reliable apps. It Provides a deeper view of your app by logging all the key activities that occur in the app as it runs. It also provides details of how the events and formulas contained in your app work, so you can improve performance and identify any errors or problems. One of its most useful features in my point of view is Collaborative troubleshooting with Users without the need to share screens with them via inviting them to Monitor Sessions. This tool will definitely make App dev’s life easy when it comes to diagnosis and troubleshooting.