Introduction
Many teams start with SharePoint lists and Power BI because the combination feels fast, low-friction and integrated. SharePoint list: a structured collection in SharePoint used to capture items or records with columns and metadata. Power BI: a data visualisation and reporting tool that can connect to many sources, including SharePoint. Early dashboards appear quickly, stakeholders are pleased, and the solution seems solved.
For a current take on why this pattern is becoming even more important as Power BI evolves, see Power BI May 2026 Update: Why a SQL Reporting Layer for SharePoint Lists Matters More Than Ever (SQList).
Why the honeymoon ends
That initial success often falls apart after a few months. Three practical, interacting forces usually cause the failure: data growth, reporting complexity and changing user expectations. Each alone can be manageable; together they create brittle solutions that stop responding to real business needs.
Data growth patterns
SharePoint is optimised for collaboration, not for high-volume analytical workloads. Lists perform well when item counts are modest and access patterns are simple. However, real business usage follows familiar patterns: teams add more records, more columns, more sites and more automation. Indexes, thresholds and throttling that were irrelevant during prototyping begin to bite as lists grow beyond tens of thousands of items.
For background on how lists behave as they scale, see the article on why lists struggle past common thresholds. This explains the operational limits that often appear between testing and production.
Reporting complexity creep
Early dashboards usually display a handful of metrics and use Power BI’s import mode or simple queries. Over time stakeholders ask for cross-site rollups, history, joins against other systems and calculated measures. Those requirements drive more expensive queries and larger in-memory models. Power BI offers two primary connectivity modes – Import and DirectQuery – and each has trade-offs for performance and freshness. When SharePoint is the data source, those trade-offs become more apparent; the details are covered in the analysis of DirectQuery versus Import for SharePoint sources.
User expectations changing over time
Initial users accept manual refreshes or occasional delays; later they expect near-real-time insights, self-service slicing and responsive visualisations. As expectations rise, so does pressure to keep the underlying data model performant. Teams often respond with quick fixes: large scheduled exports, duplicated lists, Excel snapshots or ad-hoc SQL extracts. Those workarounds can deliver short-term relief but introduce duplication, staleness and governance gaps. A recent article summarises common SharePoint reporting workarounds and why they break in production.
Practical example: a customer lifecycle dashboard
Imagine a simple SharePoint list capturing customer interactions. Early on it holds a few thousand rows and Power BI imports the list nightly. Over a year the list grows to 200,000 rows, staff create additional lists per region and stakeholders demand weekly cohort analysis. Import mode creates a large model that takes hours to refresh. DirectQuery produces slow, repeated queries against SharePoint APIs. The result: timeouts, missed refresh windows and frustrated users.
Fixes that work in the short term include archiving old items, splitting lists by site or building several smaller reports. Those techniques increase operational overhead and complicate governance.
Benefits of a pragmatic reporting architecture
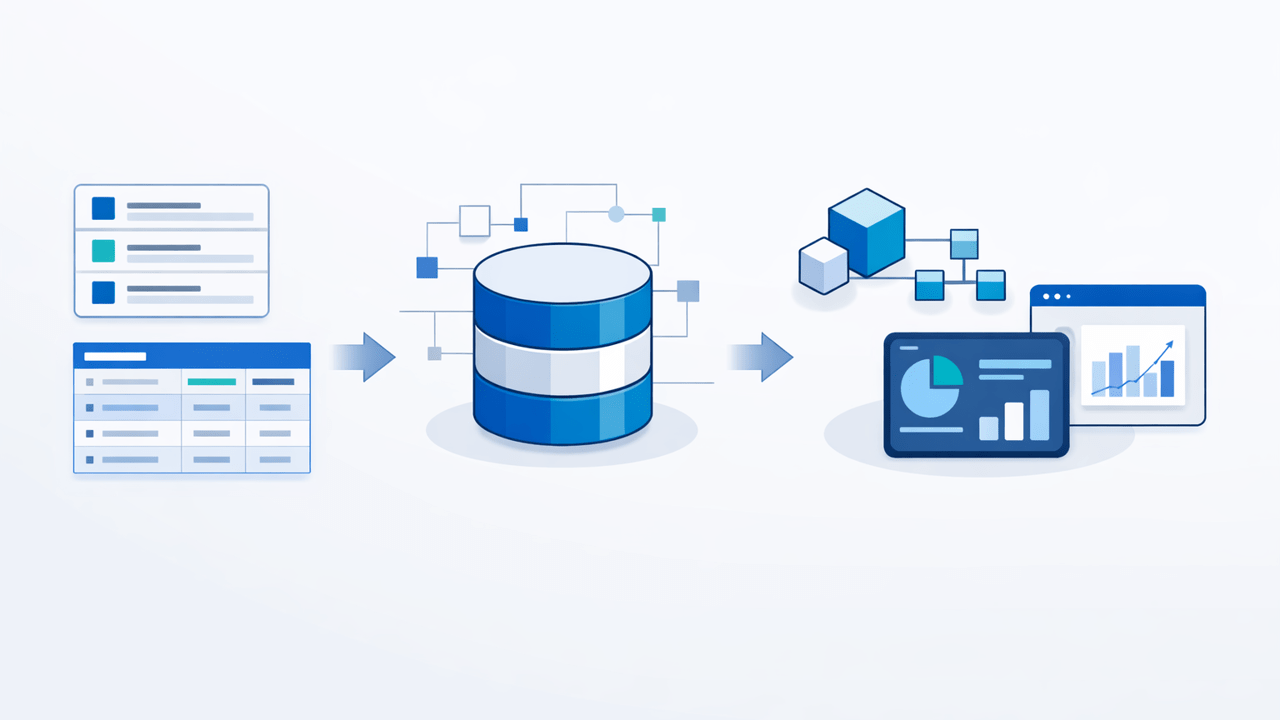
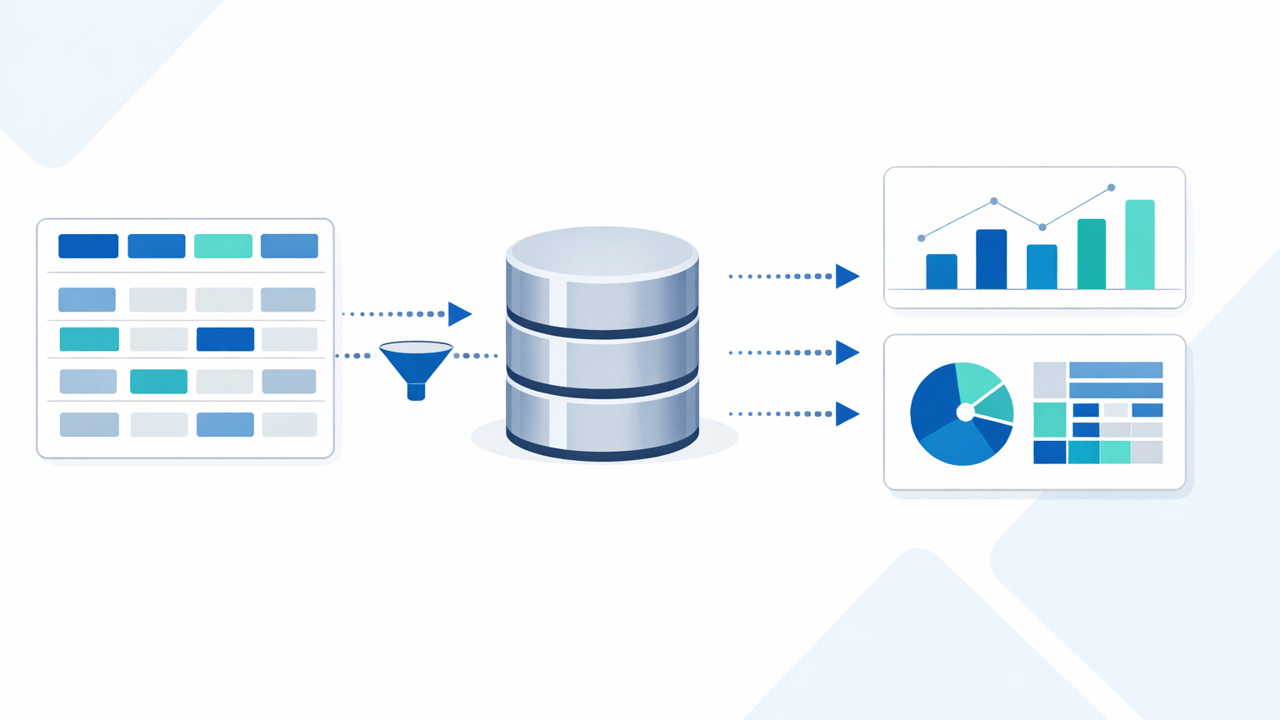
A pragmatic approach separates transactional collaboration from analytical reporting. Treat SharePoint as the source of truth for collaboration and capture, then replicate or stream relevant data into a reporting store that is designed for queries and aggregations.
- Performance: relational databases and data warehouses support indices, set-based operations and efficient aggregations.
- Predictability: scheduled loads and table partitioning make refresh windows reliable.
- Flexibility: SQL views or materialised tables can consolidate multi-site data and provide a single semantic layer for Power BI.
- Governance: a controlled replication pipeline reduces duplicated spreadsheets and undocumented exports.
For a concrete architecture that moves SharePoint list data into a SQL repository and supports responsive Power BI dashboards, see the practical architecture for real-time insights.
When this approach is appropriate and who it is intended for
This pattern is appropriate when one or more of the following apply:
- List growth: lists routinely exceed tens of thousands of items or show sustained growth.
- Complex reporting: dashboards require joins, historical retention, rollups across multiple sites or integration with other systems.
- Performance expectations: stakeholders need near-real-time dashboards or predictable refresh windows.
- Governance and audit: data lineage, retention and permission models must be consistent and auditable.
It is intended for central IT teams, BI developers and data engineers responsible for maintaining reliable reporting, and business owners who require scalable, auditable analytics rather than ad-hoc exports.
How to start without over-engineering
Begin by inventorying the lists that feed dashboards and the queries Power BI performs. Identify high-growth lists and the most expensive visualisations. Implement minimal replication for the critical columns and time window you need, then iterate. Small, well-scoped replicas often eliminate the immediate pain while allowing the team to plan a broader architecture.
Be cautious about premature full-scale migration of every list; not every collaborative list needs to be part of the reporting store. Focus on the records that drive reporting value.
Practical tools and options
Several approaches can be used to replicate SharePoint data into a reporting store: scheduled extracts using platform APIs, ETL pipelines, change-feed based replication, or specialised tools that preserve metadata and structure. The right choice depends on volume, latency and available skills.
One pragmatic option to consider is SQList, a product that replicates SharePoint lists into SQL Server while preserving list structure and some metadata. Using a purpose-built replication layer can reduce engineering time and help future-proof reporting while keeping SharePoint as the collaboration surface.
If you want a newer semantic-model-focused view of the same problem, see Preparing SharePoint List Data for Power BI Semantic Models and Fabric Apps with SQList.
Related reading
For readers who want deeper technical guidance, the following articles explore specific trade-offs and common pitfalls:
- Power BI DirectQuery vs Import When SharePoint Is the Source – details on the connectivity modes and their trade-offs.
- Common SharePoint Reporting Workarounds – and Why They Break – patterns that appear during emergency fixes.
- From SharePoint Lists to Real-Time Insights: A Practical Architecture for Power BI – a pragmatic architecture for moving list data into SQL for responsive dashboards.
- The Hidden Cost of Using SharePoint as a Reporting Database – why SharePoint is not optimised for analytical workloads.
Conclusion
Startups and teams love SharePoint plus Power BI because they accelerate initial delivery. But as data volumes, complexity and expectations grow, that combination often becomes fragile. Recognising the lifecycle – from prototype to scale – lets teams adopt a pragmatic architecture that retains the collaboration benefits of SharePoint while moving analytics to a store designed for reporting. That pattern restores performance, reduces risk and makes dashboards sustainable.
#sharepoint #powerbi #reporting #dataintegration #businessintelligence