Power BI keeps getting better at modelling, calculating and explaining business metrics. The May 2026 Power BI Desktop update highlights features like Copilot summary shortcuts, visual calculations and custom totals becoming generally available, and a new Get Data experience (preview). Those improvements are great news – but they also raise the bar for data quality, governance and refresh reliability.
If your source data lives in SharePoint lists (or Microsoft Lists backed by SharePoint), the fastest way to unlock the newest Power BI and Microsoft Fabric capabilities is to stop treating SharePoint as a reporting database. Keep SharePoint as the operational UI and system of record, and use a SQL Server reporting layer for analytics. With SQList, AxioWorks’ flagship product, you can synchronize SharePoint lists and libraries into SQL Server on a schedule and then build robust reporting over that SQL copy.
Why the May 2026 update makes architecture matter
New modelling and AI-assisted experiences are most useful when your dataset is:
- Stable: consistent column names and data types, predictable refresh behavior.
- Performant: low latency for queries and calculations, especially at scale.
- Governed: clear ownership, auditing, and repeatable transformation logic.
- Shareable: reusable semantic models, measures, and views across teams.
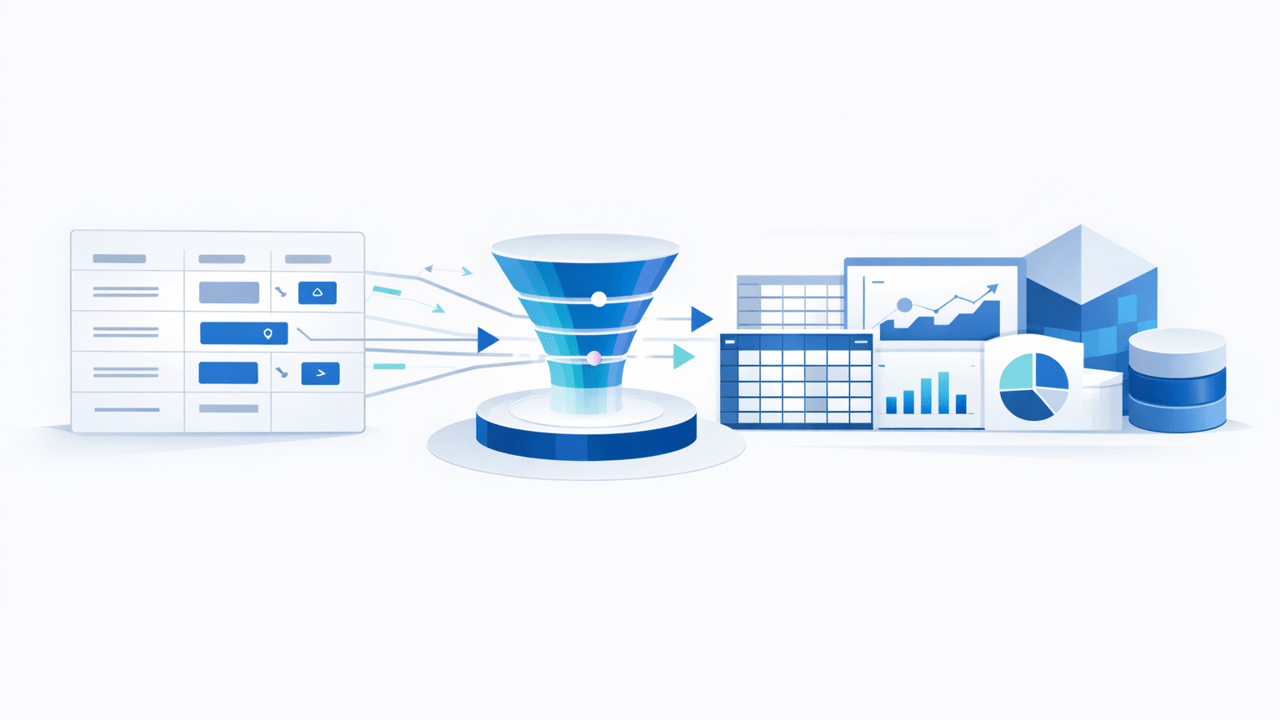
Directly connecting Power BI to SharePoint lists can work for small prototypes, but it tends to become fragile as lists grow, schemas evolve, permissions vary by site, and refresh needs increase.
Related reading:
- Why Power BI and SharePoint Work Well at First – Then Suddenly Don’t
- Power BI DirectQuery vs Import When SharePoint Is the Source
- Why SharePoint Lists Struggle Beyond 50,000 Items
The problem with using SharePoint as the analytics engine
SharePoint is designed for collaboration, permissions, and content management. It is not optimized as a high-throughput analytical database. Common symptoms when reporting directly over SharePoint lists include:
- Slow or inconsistent refresh times.
- Throttling and intermittent connector issues.
- Difficult cross-site reporting and consolidation.
- Complex field types (lookups, people, managed metadata) that are awkward to model.
- Hard-to-govern transformations duplicated across many Power BI files.
When those issues appear, teams often add workaround layers that eventually break. A SQL layer is usually the cleanest long-term fix.
See also: Common SharePoint Reporting Workarounds – and Why They Break
A practical pattern: SharePoint as UI, SQL Server as reporting layer
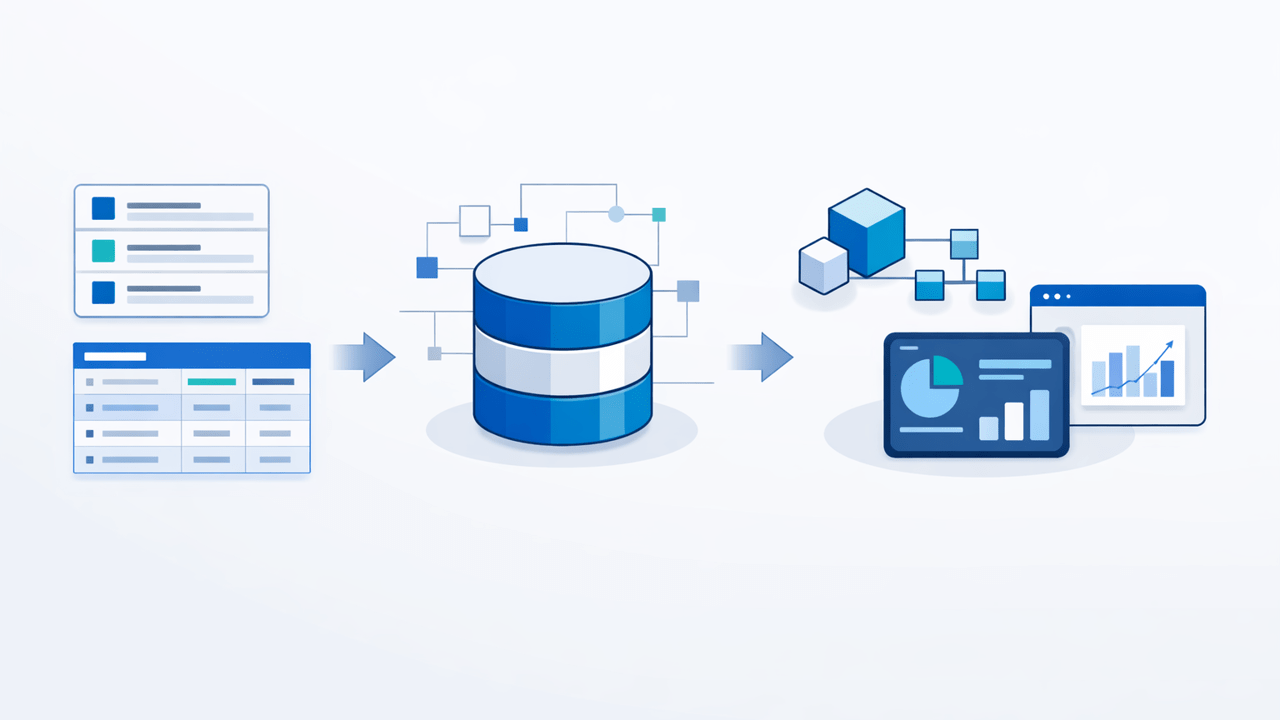
The most resilient approach is a three-layer architecture:
- Operational layer: SharePoint lists and libraries remain the place users create and manage items and documents.
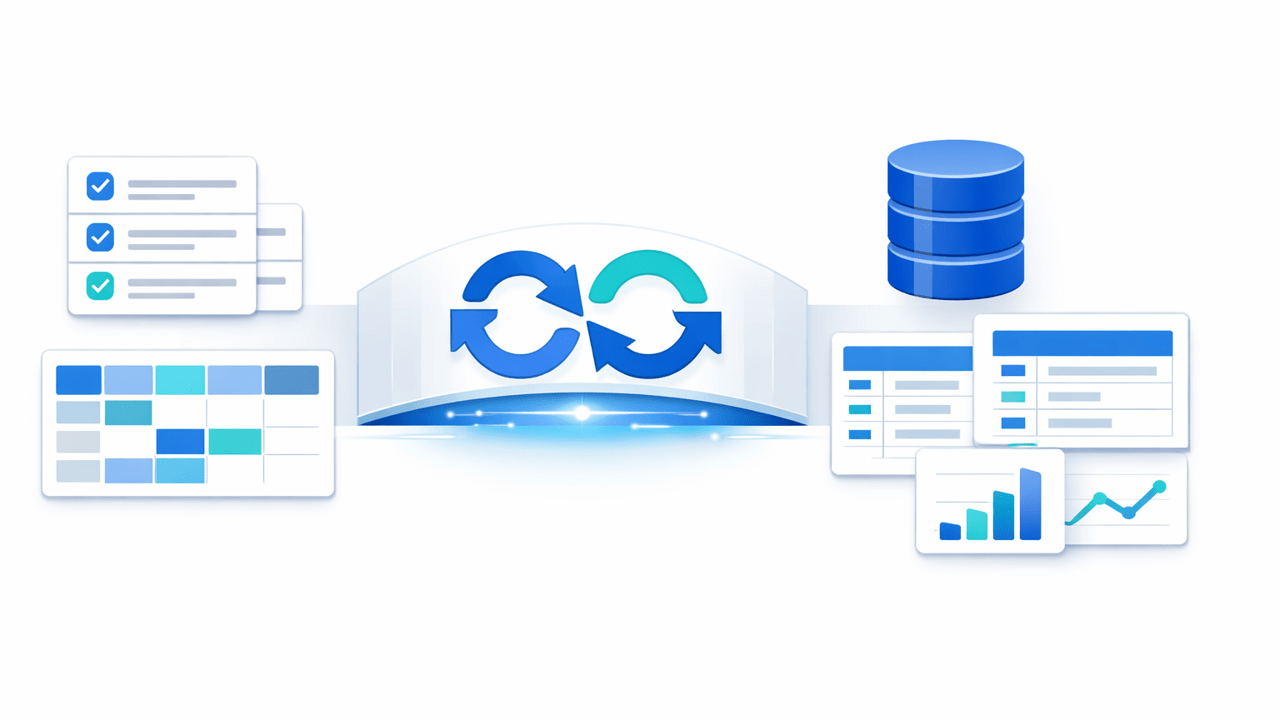
- Synchronization layer: SQList synchronizes selected lists/libraries to SQL Server tables on a schedule (and can also keep deleted/changed items consistent).
- Analytics layer: Power BI (and Fabric) connects to SQL Server views/tables for modelling, measures, and dashboards.
This pattern gives you the collaboration benefits of SharePoint plus the analytics strengths of SQL Server: indexing, set-based queries, stable schemas, and repeatable transformations.
How this helps you use Power BI and Fabric features effectively
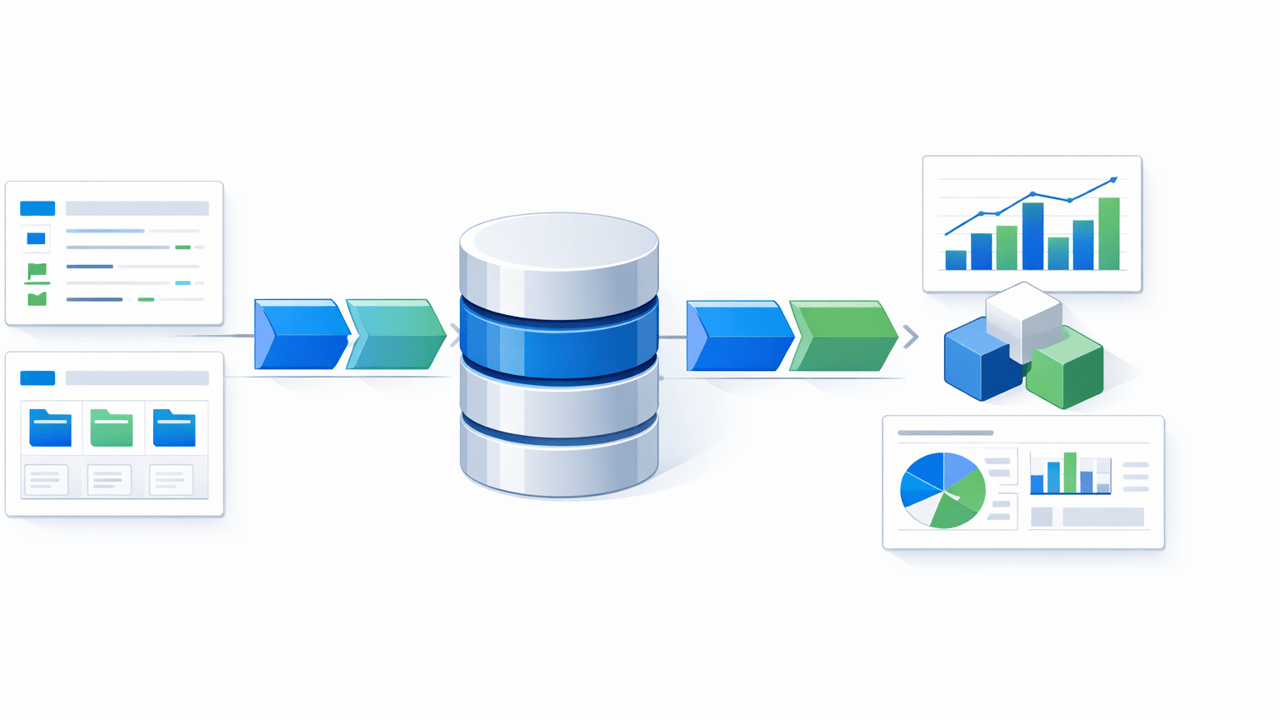
With SharePoint data synchronized into SQL Server, it becomes much easier to:
- Build consistent datasets and semantic models that multiple reports can reuse.
- Centralize business logic in SQL views (or in a curated star schema) instead of duplicating Power Query steps everywhere.
- Improve refresh reliability and performance by querying SQL rather than SharePoint endpoints.
- Support near-real-time reporting by increasing sync frequency without overwhelming SharePoint.
- Adopt Copilot-assisted summarization and explanation features with more confidence in the underlying data.
Implementation checklist (high level)
- Identify the SharePoint lists/libraries that drive reporting.
- Define a SQL Server database to act as your reporting repository.
- Configure SQList to synchronize the chosen lists/libraries into SQL tables.
- Create SQL views for reporting-friendly shapes (types, joins, lookups, date tables, etc.).
- Connect Power BI to SQL, choose Import or DirectQuery based on dataset size and freshness needs, and standardize measures.
Where SQList fits
SQList is purpose-built for synchronizing SharePoint lists and libraries into SQL Server. It is designed for real-world reporting and integration scenarios, where you need a reliable and repeatable pipeline from SharePoint to a relational reporting store.
If you are planning to take advantage of the newest Power BI Desktop improvements (and broader Fabric capabilities), start by making the data layer dependable. A SQL reporting layer backed by SQList is a pragmatic foundation.
Further reading (public sources)
Hashtags: #SharePoint #SQLServer #PowerBI #MicrosoftFabric #DataIntegration #Reporting #SQList