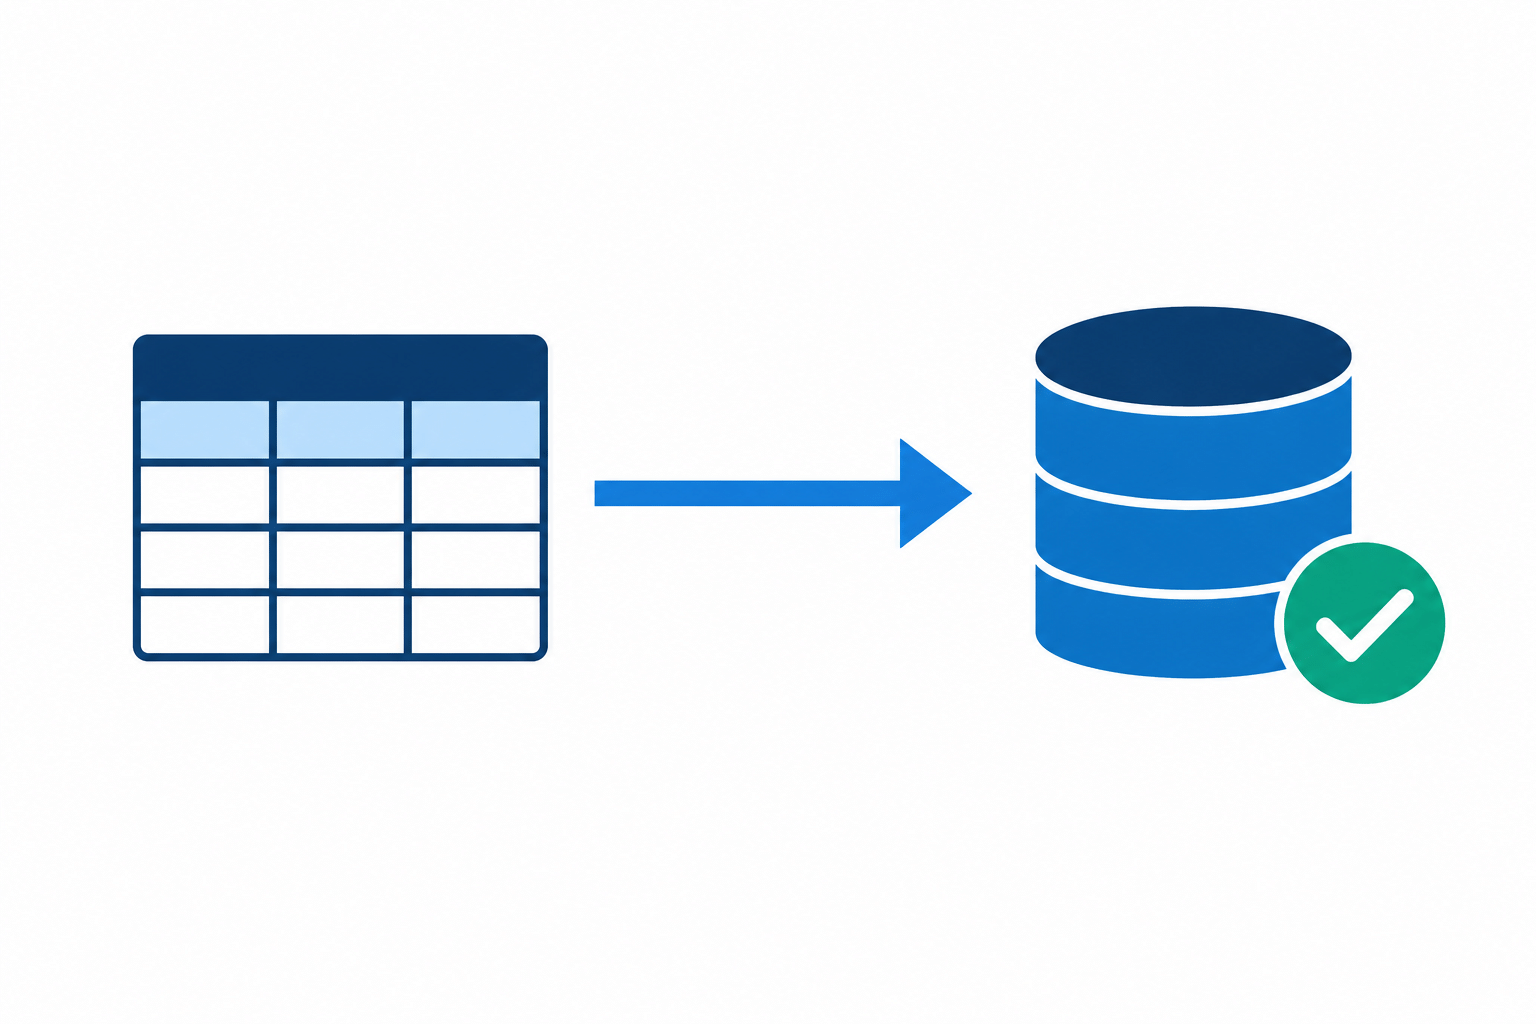
Replicating SharePoint data to SQL Server gives reporting and integration workloads a more suitable place to query operational information. Once the process is live, though, a green status alone does not tell you whether the right changes reached the right tables on time.
A useful monitoring approach follows the data from its source to its consumers. It defines what “up to date” means, checks for errors and unexpected changes, and makes it clear who should act when a check fails. The details depend on your synchronisation tool and operating model, but the principles are broadly the same.
Define what “up to date” means
Start with a freshness target that reflects how people use the data. A daily operational report may need a different target from a dashboard used during the working day. Record the expected interval, the time zone, and how long a delayed run can continue before it becomes an incident.
Use a timestamp that represents successful completion, not merely the time a process started. Compare that value with the agreed target and make the threshold visible to the people responsible for the data. This turns “it seems stale” into a check that can be investigated.
Monitor the whole path
SharePoint-to-SQL Server synchronisation is one stage in a reporting path. Check each stage that matters to your architecture:
- Process availability: is the synchronisation service or scheduled process running?
- Completion and duration: when did it last finish successfully, and how does its duration compare with its normal range?
- Errors and retries: are there repeated failures, throttling events, connectivity problems, or permissions issues that need attention?
- Data movement: did the run detect or process a plausible amount of data for the lists being monitored?
- Downstream freshness: after the SQL data is current, did the report or model refresh that depends on it also complete?
Use the logs and status information that your chosen tool actually provides. Avoid assuming that every product exposes the same counters. Where a measure is unavailable, add a separate check at the SQL or reporting layer rather than treating an absent metric as proof of health.
Check important records, not only job status
A process can complete successfully while a particular change is missing or a downstream query is reading the wrong table. For critical data, choose a small number of representative records and verify that expected changes appear in SQL Server within the agreed time. Include updates and deletions where those are important to the business process.
For larger datasets, use controlled reconciliation checks rather than repeatedly comparing every row. For example, compare item counts or selected business keys for a defined scope, and investigate material differences. Make sure the check accounts for filters, permissions, archived data, and the timing of the source and target snapshots.
If a Power BI report is stale, trace a known changed item through SharePoint, the SQL reporting layer, the semantic model, and the visual. Our guide to tracing a missing change when a SharePoint Power BI report does not update describes that investigation path.
Watch for schema changes and target-side failures
SharePoint lists evolve as teams add columns, change choices, or adjust processes. Review how those changes affect the SQL tables and the reports that depend on them. Pay attention to column names and types, required fields, constraints, and assumptions in views or stored procedures.
Keep a lightweight change record for important lists: what changed, when it was noticed, which SQL objects or reports depend on it, and who confirmed the result. This makes it easier to distinguish a normal business change from an unexpected break in a data contract. See our article on keeping SQL Server reporting and Fabric models stable when SharePoint list schemas change.
Separate synchronisation health from report freshness
There are at least two different questions: has the SharePoint data reached SQL Server, and has the report or model refreshed from SQL Server? Track these stages separately. If both are represented by one “last refreshed” timestamp, diagnosis becomes harder because a delay at either stage can look the same to a report user.
Where possible, show the data timestamp in the reporting experience and document the expected refresh sequence. This gives users context and helps support teams identify whether the delay is in source synchronisation, SQL processing, or the reporting service.
Make alerts actionable
An alert should tell its recipient what failed, which data or process is affected, when it last succeeded, and where to begin investigating. Set thresholds that account for normal variation and avoid sending a notification for every short-lived retry. Assign an owner and keep a short runbook for recurring causes such as expired credentials, network interruptions, schema changes, or SQL storage pressure.
Review the checks after changes to the source lists, SQL environment, or reporting schedule. Monitoring is useful when it reflects the current data path and reaches someone who can act on it.
Putting SQList in context
AxioWorks SQList replicates SharePoint list and library data to SQL Server, where teams can use familiar SQL tools for reporting, Power BI, and downstream integration. A clear monitoring plan complements that architecture: it sets the freshness expectation, checks the stages that matter to your organisation, and helps you find the cause when data is late or incomplete.