A SharePoint work list can tell you how many requests are open today. If people update the same items as they work, counting today’s open rows by creation date won’t tell you how many requests were open last Friday. To answer that question, capture the open backlog at regular cut-offs and keep each result.
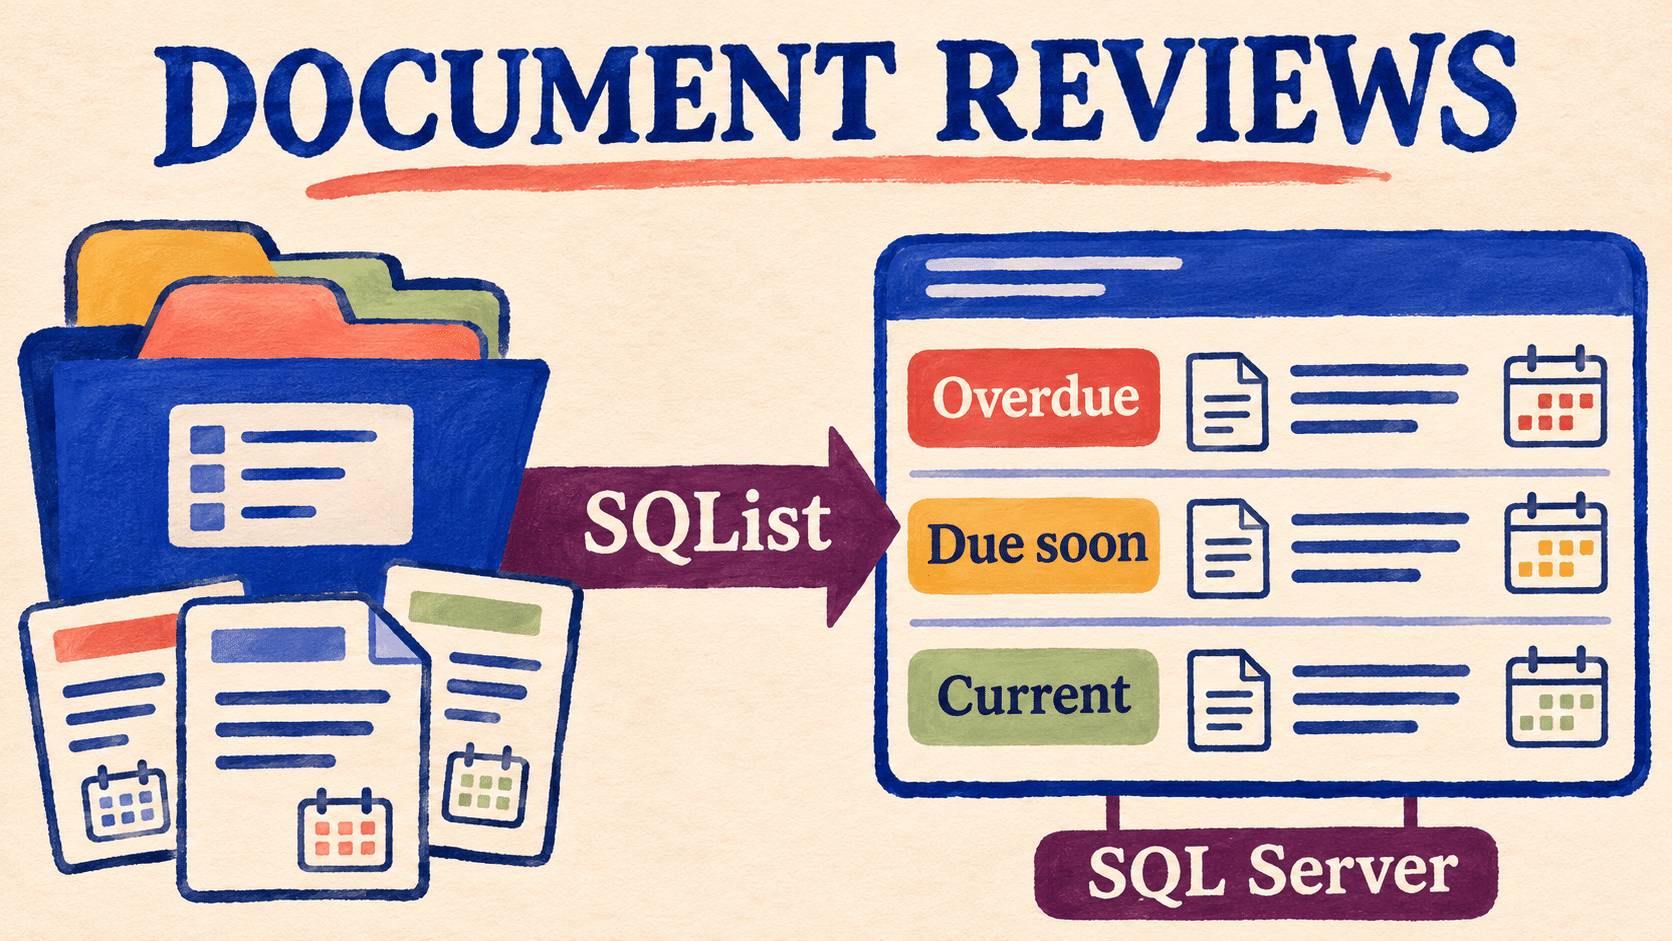
AxioWorks SQList can replicate the SharePoint work lists into SQL Server. A separate SQL reporting job can then take a weekly snapshot of the replicated data, and Power BI can chart those snapshots without asking every team to keep a spreadsheet.
Decide what the backlog means
Agree on which items count as open. For a service desk that might include New, Assigned and Waiting for customer, while excluding Resolved and Cancelled. If teams use different statuses, map them to common reporting categories and flag unmapped values. Otherwise a new status can quietly change your counts.
Choose a cut-off, such as Friday at 17:00 in the team’s business time zone. Store the reporting week and the actual capture time separately. A job that runs at 17:20 should not silently label its result as an exact 17:00 observation. Where the business requires an exact historical cut-off, a scheduled read of a current replica may not be sufficient.
Capture one row per open item per week
For a report that needs to show which items were open, store one row per reporting week, source list and SharePoint item ID. Include the team or queue, status and other fields you need to analyse as they stood at capture time. If you only need headline counts, a smaller snapshot with one count per week and queue may suffice, but it won’t support item-level investigation.
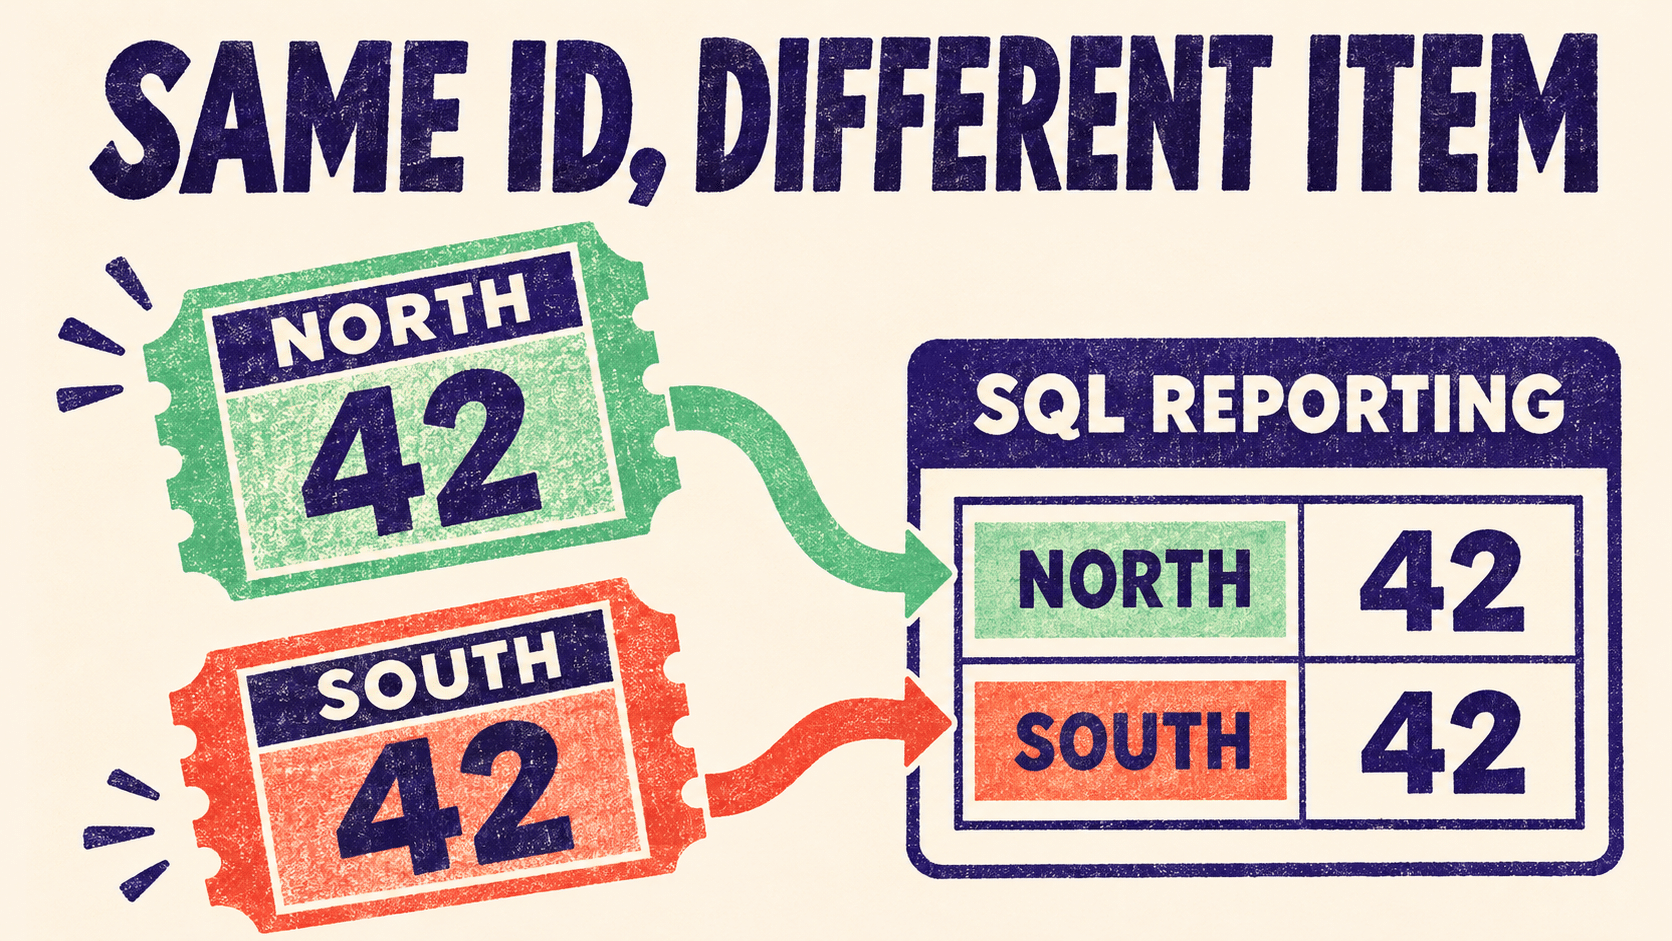
Keep source-list identity in the key. Two lists can both contain item 42. See our guide to combining SharePoint lists without losing item identity. Similarly, if you need to know which queue owned an item last week, retain that value in the snapshot. Joining an old snapshot to today’s queue assignment can rewrite the story the chart tells.
Build the capture job over a reporting view that selects the required fields from the SQList tables. Save the results in a separate reporting table. Use a unique key for the agreed row identity and make retries safe: a retry should not double the counts or replace an already accepted capture with newer data by accident. SQL Server Agent jobs are one scheduling option where available; an existing scheduler can also run the capture.
Distinguish a zero backlog from a missing capture
Record successful and failed runs separately from the snapshot rows. If all queues are empty, the job may legitimately write no item rows. A failed job may also leave no rows. In Power BI, show zero only for a successful capture covering the intended scope; flag a missed or incomplete capture as missing data.
Check whether the required lists have caught up before accepting the result. If they are stale or a source is unavailable, mark the capture accordingly and follow your retry policy. Capture time describes when the SQL reporting job read the data, not when every source list was last synchronised. Our SharePoint-to-SQL Server monitoring guide explains how to check the stages separately.
Read the resulting chart correctly
Use the snapshot week as the date axis. Count rows for each completed week at the chosen detail level, and use the captured queue or status to break down the result. This follows Microsoft’s Power BI modelling guidance to define what each fact row represents before building measures. A request open across three Fridays counts once in each of those weeks. Adding those three weekly totals together does not give a count of distinct requests.
A weekly snapshot answers “what was observed at each capture?” It misses changes that start and finish between captures. If you need a finer history of changes applied in SQL, consider SQL Server temporal tables. AxioWorks’ system versioning guide explains why SQL row history can differ from SharePoint version history, especially when several source changes happen between replication cycles.
Prove the pattern with two captures
Start with one representative work list. Capture its open items, then use approved test records to close one request, reassign another and add a new one. Confirm that the next capture reflects the changes while the earlier one stays intact. Also check what the report shows for an empty queue and for a failed run. Only then extend the model to more sites or teams.
If your team needs a repeatable SQL source for several SharePoint queues, request a free SQList evaluation and use that two-capture exercise to assess the flow in your own environment. SQList provides the replicated data; your reporting job owns the cut-off, snapshot rules and historical storage.