Power BI is a no code analytics and reporting tool from Microsoft which allows business users to generate sleek and customizable reports and interact quickly and easily with their data using simple drag-and-drop features. It is an extremely feature rich yet user-friendly reporting tool which can also be used for creating live dashboards and then sharing them with your colleagues or embed them in your app, website, or SharePoint portal. It is compatible with over 65 different data sources out of the box including both on-premises and cloud products.
It comes in two flavors, Power BI Desktop which is the free version available through your Microsoft Account and provides support to various data sources and provides lots of features to satisfy your reporting needs. Power BI Pro is the more advanced and paid version which will allow you to take your reports to the next level with massive reporting functionality along with some cool collaboration features. In this article, we are going to use Power BI Desktop with SharePoint List and SQL Server as a data source to set up a simple report and then analyze which one outweighs the other in terms of ease of use, performance, and features.
Using SharePoint List as a Data source
Power BI helps the SharePoint admins and users to analyse data stored in SharePoint lists and libraries both online and On-Premises. Let’s have a look at how to setup SharePoint list as a data source and use the data to generate a bar chart.
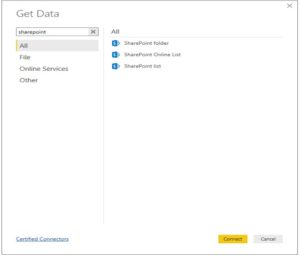
Open power BI and Select SharePoint List as Data Source from the list of data sources:
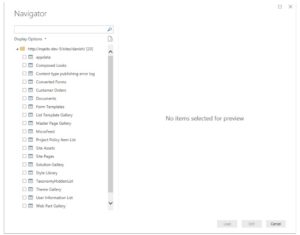
A prompt will open up, enter the SharePoint site URL. Note: Don’t include the list in URL.
Then enter the credentials you want to use to connect to the site or use Windows Credentials. Then select the list which contains the data you want to generate report for and press load.
This will load all the fields of the list in the right pane and now your list is ready to be used in your report. By default, it will load all the columns so in order to reduce the loading time, remove the columns you don’t need by going to edit data source.
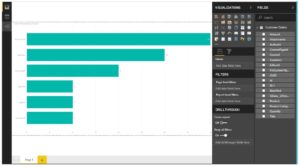
Next, Select a visualization type from Visualizations Pane e.g. bar chart. In the Axis, drag and drop the column you want to appear on y-axis and In Value, drag and drop the column you want to use for showing the values. (In our example, we will use product name in axis and quantity in value).
That’s all you need to do to configure the bar chart. You can apply all types of formatting and customization from format section.
Using SQL Server database as a Data source
If you think using SharePoint list as a data source was exciting, then wait till you see what you can do with your data in a SQL Server database. So, let’s start by selecting SQL Server as data source and enter Server name and Database.
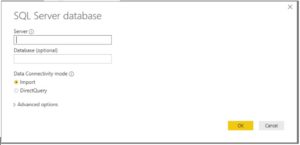
You can either Import data which will fetch the entire dataset and store it in Power BI or use Direct Query to get the data from database on runtime.
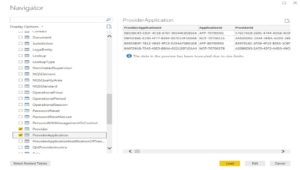
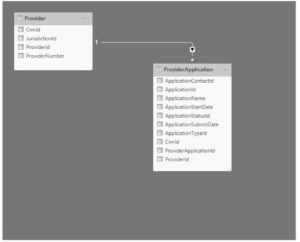
Next, you will see all the tables and views available in the database and you can select multiple tables to generate report from or if you already have a defined view then you can use it as a data source. This is where your SQL skills will really come in handy and you can define your view in the database and use it for your reporting purposes here. In this example we will select multiple tables.
That’s pretty much it as far as setup goes and the data from the selected tables will be imported as well as the relationship associated with the tables which you can see by going to Home- > Manage Relationships.
In order to setup a report, add a new Page and then add new visual table. Drag and drop the columns you want to appear in your report from related tables to generate your report.

In order to make the report more interactive, you can add columns in drill down section which allows user to further drill into the data to gain more insights.
There you have it, as you can see with Power BI it’s fairly straight forward to setup reports and fetch data from SharePoint List and SQL Server. Now, let’s compare them to see which one offers more benefits.
AxioWorks SQList continuously export SharePoint lists and libraries as normalised SQL Server tables with SQList by AxioWorks, making SharePoint data available to reporting tools like Power BI, Crystal Reports, or SSRS.
Pros and Cons of Power BI using SharePoint List
Pros
- Allows users to generate reports from SharePoint Lists and Libraries data.
- No Coding is required to configure.
- Can select multiple lists.
- Define relationships between the lists.
Cons
- Can’t use SharePoint user defined views.
- User information doesn’t come by default and can only be available by using User Information list.
- Need to define relationships for multiple lists.
- Can’t import data into Power BI which means visualizations might run slow when dealing with large lists.
Pros and Cons of Power BI using SQL Server
Pros
- Multiple tables can be used to each comes within its own dataset and can be merged as well.
- SQL Views can be used for generating reports.
- Relationships between the tables are loaded by default.
- Data can be imported into Power BI which can then be used for creating visualizations offline.
- Can be used by business users to generate report without any knowledge of SQL.
Cons
- Writing queries in Power BI can be difficult because the syntax is different from SQL.
- Difficult to migrate existing reports from SSRS.
AxioWorks SQList allows you to export SharePoint lists & libraries as normalised SQL Server tables, and build powerful reports on SharePoint data using SSRS, Crystal Reports, Power BI, on an other reporting tool.
Final Verdict
Power BI is a very intuitive and user-friendly tool which provides business users the ability to generate reports without writing any code or SQL queries. Its integration with SharePoint lists and libraries is impressive but you can do a lot more if you use it with SQL Server which makes it easier to generate reports by utilizing the existing defined relationships and views in SQL Server. Ability to import data into Power BI will allow users to generate visualizations offline. The best part is that it’s free, which means there is no downside of using it if you need a reporting tool.