In this blog, we will go through essential steps on how to generate a report and chart in Google Data Studio using data coming from SharePoint lists. We will start off by looking at the lists which we are going to use for this demo and followed by how we can use SQList to replicate data from SharePoint Lists to SQL Server database which will later be used in Google Data Studio to generate a chart and to finish things off, we will look at how to display the report in SharePoint.
Scenario
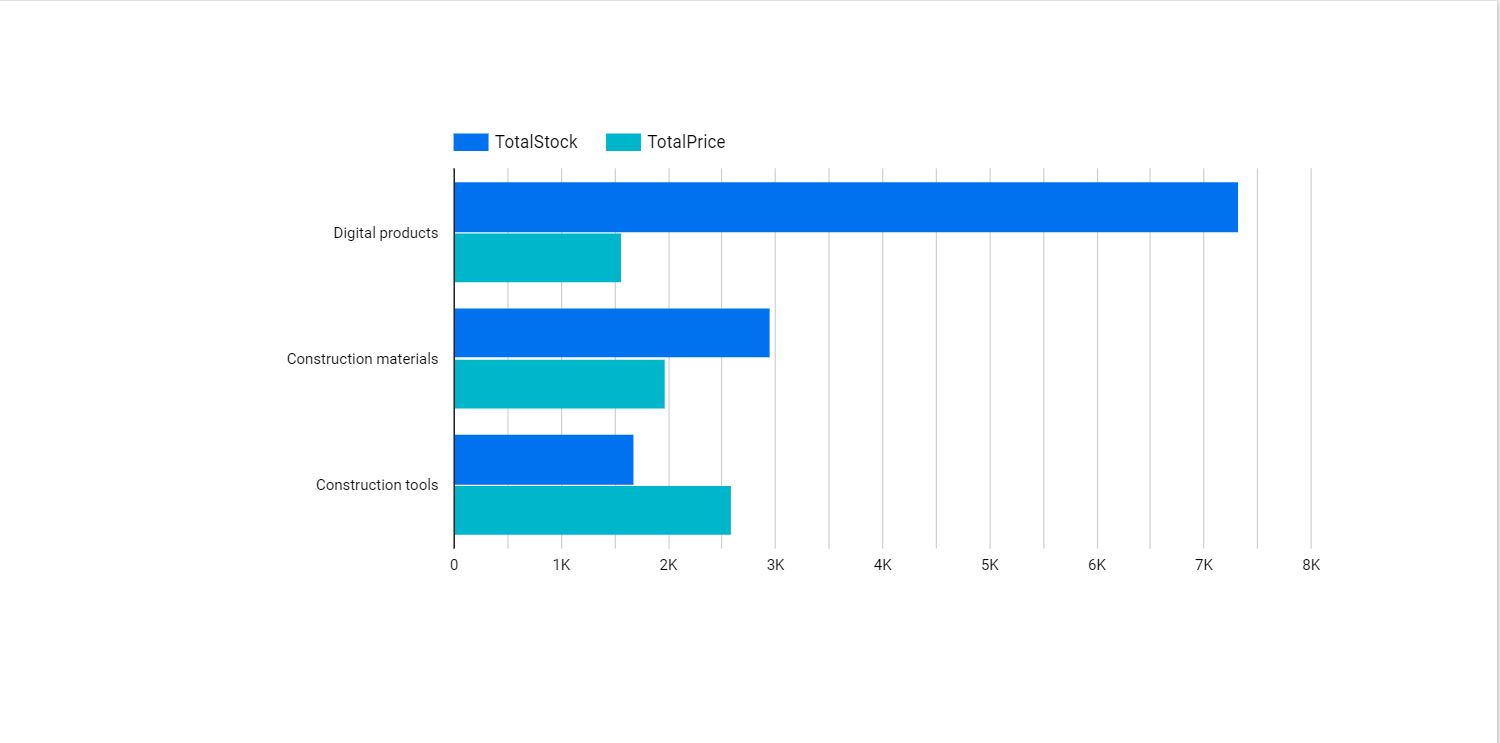
Create a bar chart in Data studio which shows the total price and total current stock of products by Category Group.
SharePoint Lists
For this demo, we will use three custom lists with some data in SharePoint.
Product list
- This list contains all the products data.
- Columns
- Title (Single Line of Text)
- Unit Price (Money)
- Current Stock (Number)
- Category ID (lookup column linked to category list).
Category List
- It is a custom list which contains data of all the product categories.
- Columns
- Title (Single Line of Text)
- Category group ID (lookup column linked to Category groups list).
Category Group List
- It is a custom list which contains data of all the product category groups.
- Columns
- Title (Single Line of Text)
Step-1: Create a Database in SQL Server
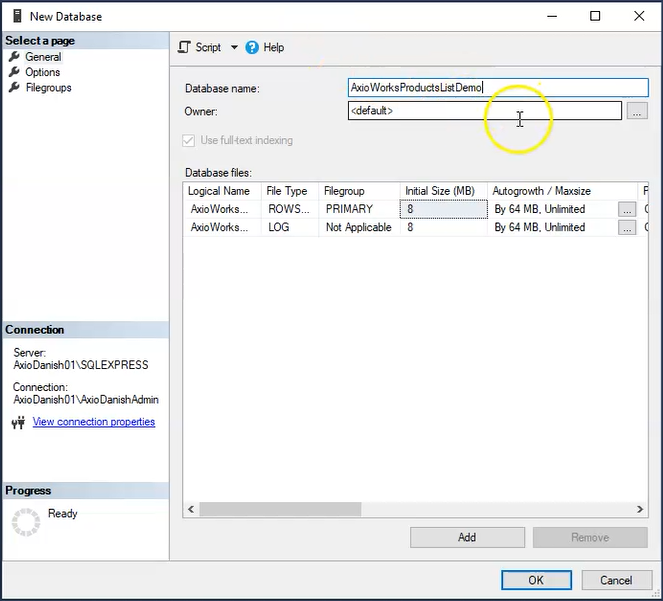
First off, we need a database that will be used for replicating the data coming from SharePoint lists.
- Open SQL Server Management Studio and create a new database named “ProductsReportdemo”.
Step-2: Replicate and Synchronize data to Database
Secondly, we need to replicate the data from SharePoint lists into SQL Server database. We will use SQList to achieve that.
- Open SQList Manager and click on “Create a new replication”.
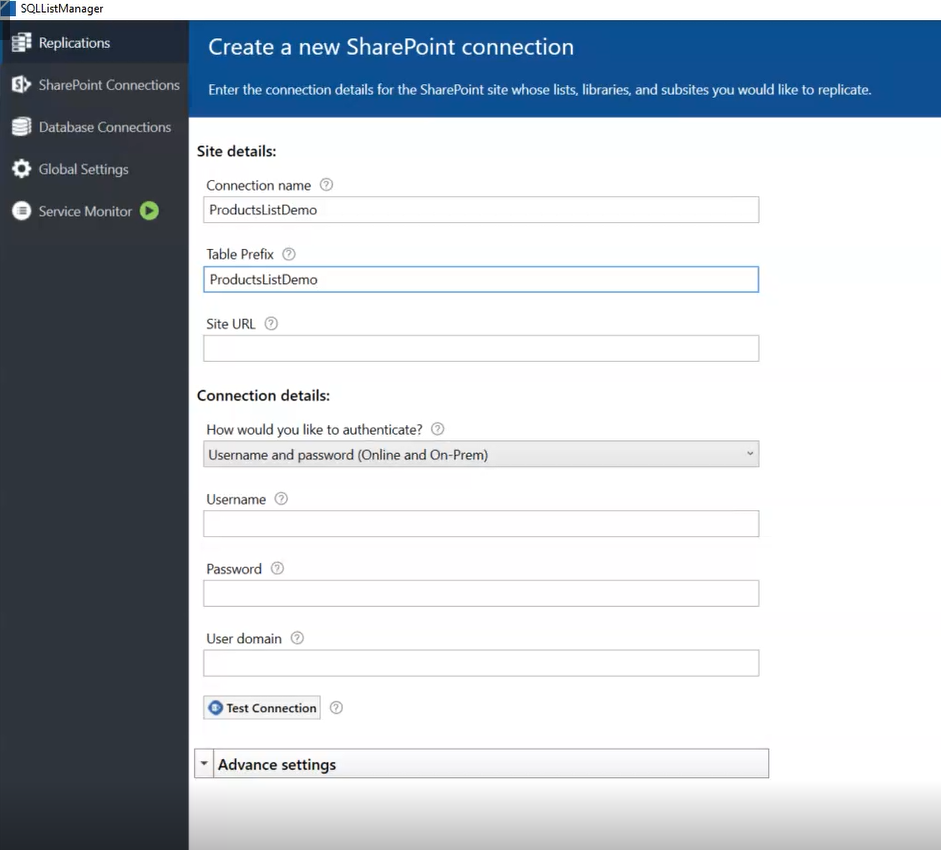
- Create a new SharePoint connection, enter the connection name and Table prefix
- and select the SharePoint site which contains the lists and clicks next.
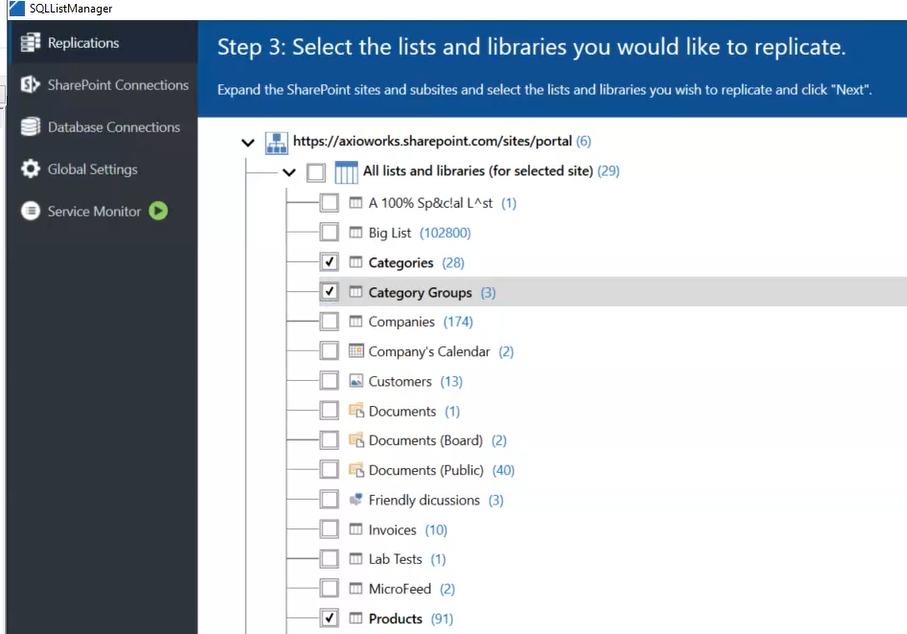
- Next step is to select the replication lists, we will select the 3 lists which are going to be used for this exercise i.e. Product, Category and Category Group.
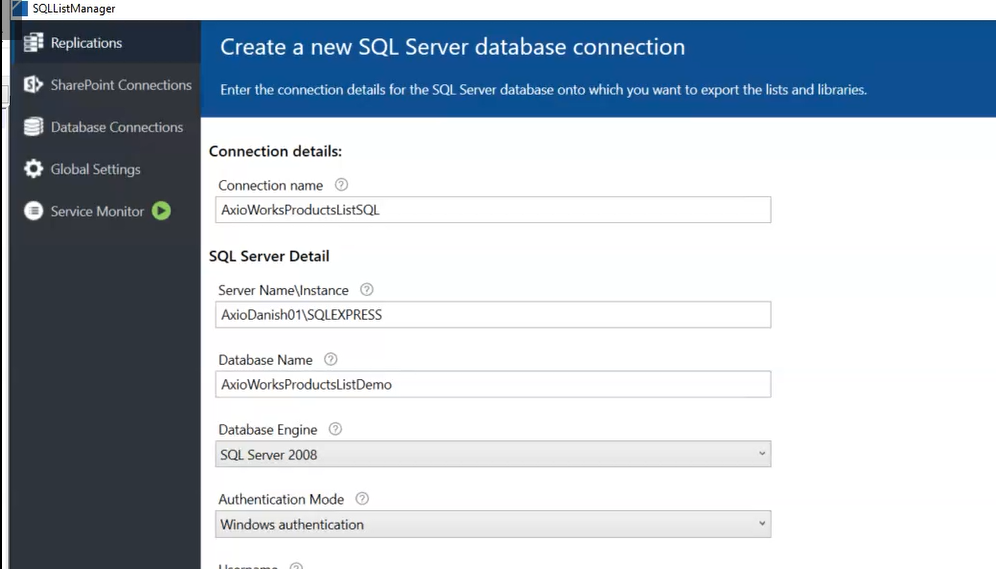
- Next, enter the details for the destination SQL database connection which is the database we created earlier.
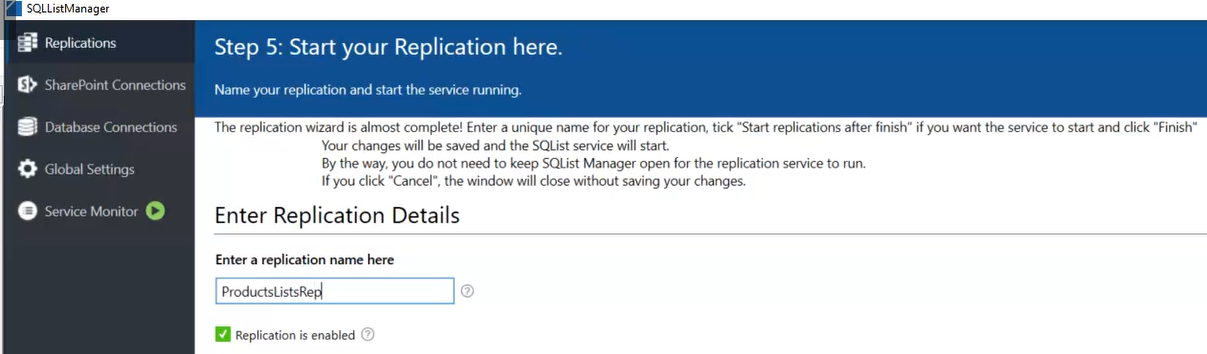
- Last step is to give this replication a name, and keep the default options as checked and then click finish.
- Once the replication is created, SQList replication service will start off for synchronizing the SharePoint lists and SQL database.
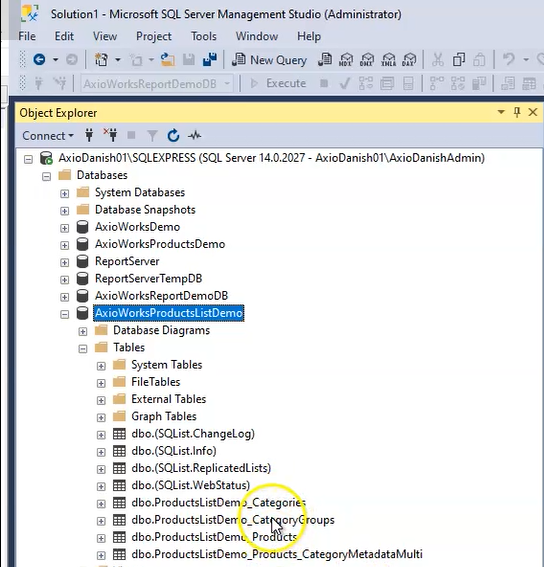
- Once the service is started, you will see that some tables have been created in the destination database including the tables for the lists which we selected.
Note: SQList will keep the database in-sync with the SharePoint lists which means any updates made in the lists will be replicated in this database as well.
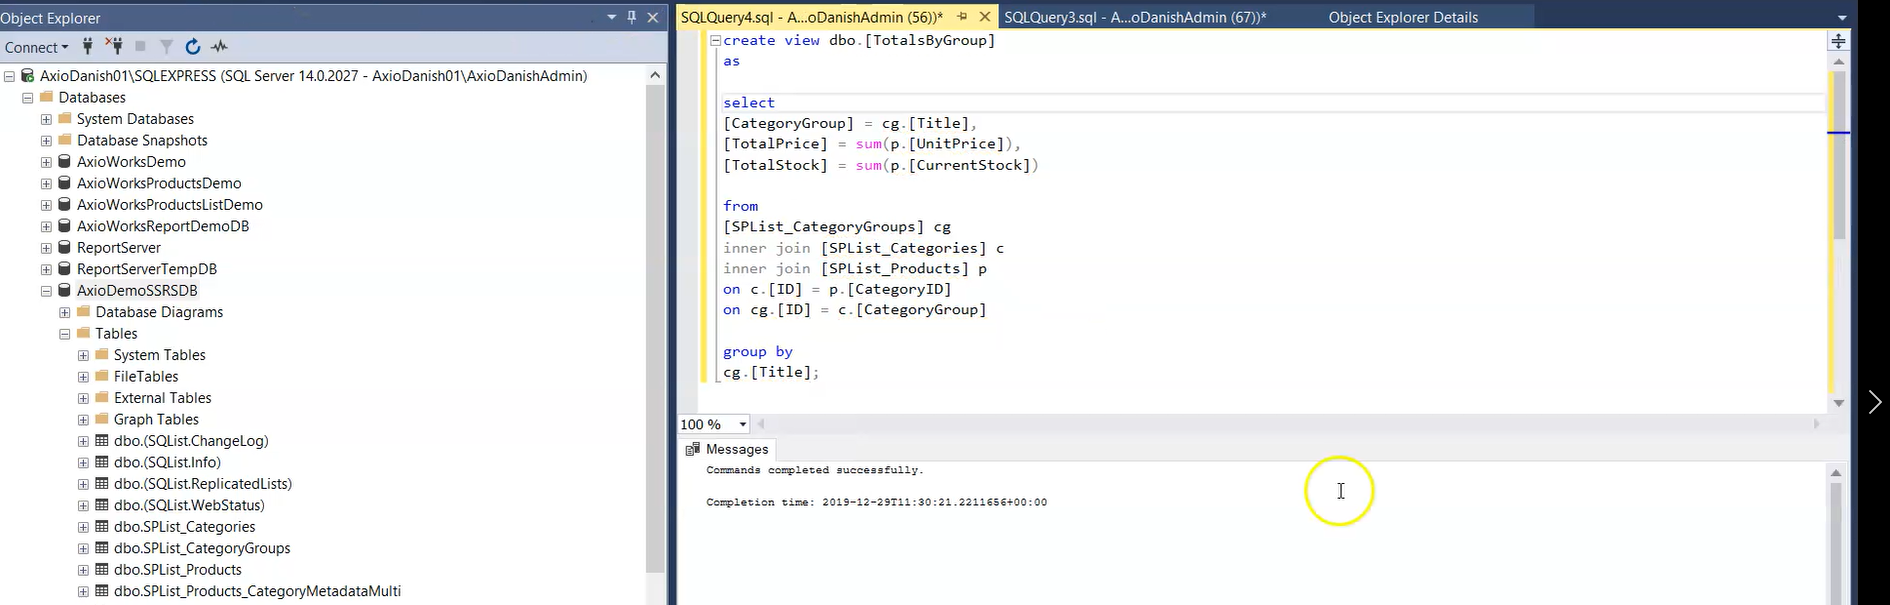
- In order to generate a report in Google Data Studio, we will need a SQL view for the dataset.
- So, Let’s create a view that includes the Product category title, Sum of UnitPrice and Sum of CurrentStock from Product list.
Step-3: Generate a Chart in Google Datastudio
- First off, we need to export data from SQL Server in order to use it as a dataset in Google Data Studio.
- Right click on Database and select export data.
- Select SQL local instance as the data source.
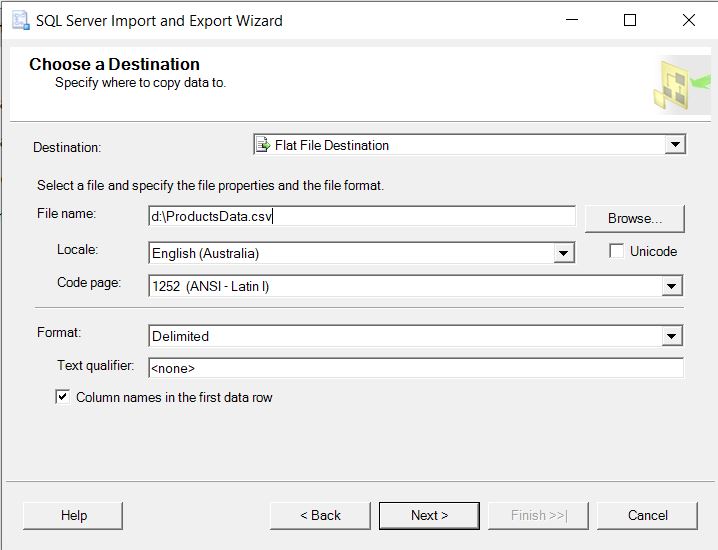
- Select Flat file as destination and save file as .csv.
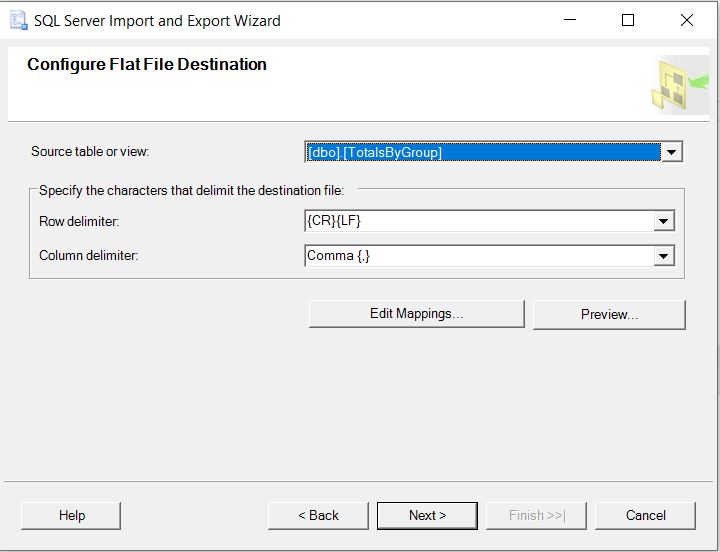
- Select the SQL View which we created earlier.
- Click finish. Now we have exported the data of SharePoint list.
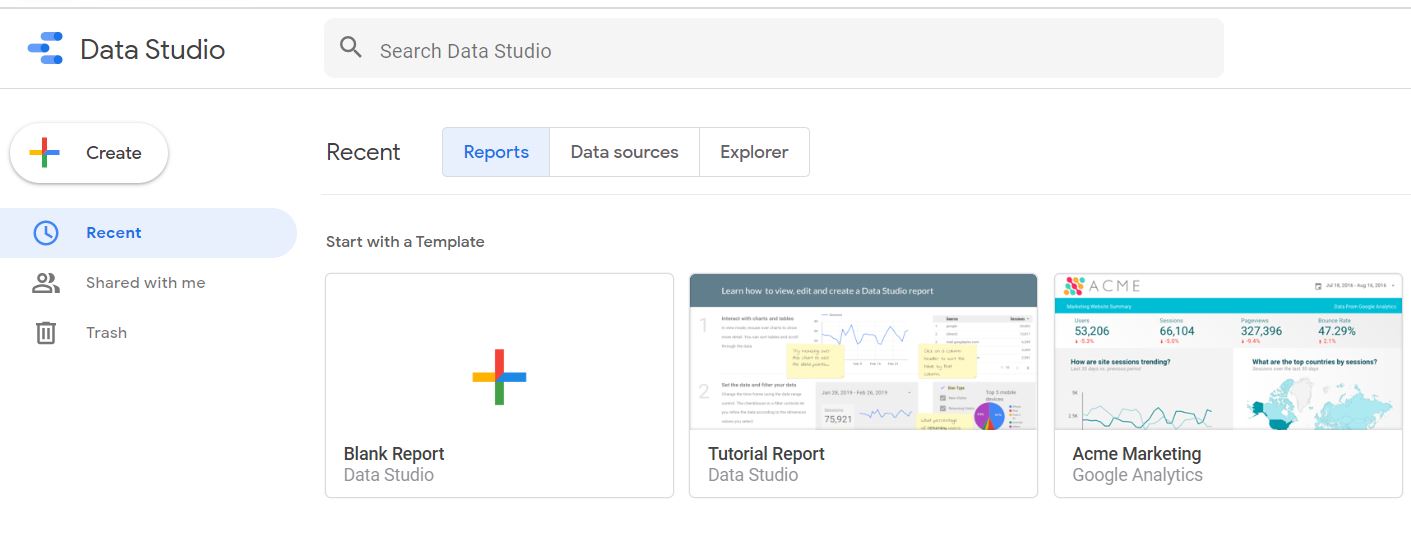
- Open Google Data Studio and start creating a new Blank Report.
- Select add data which will open up the data sources window.
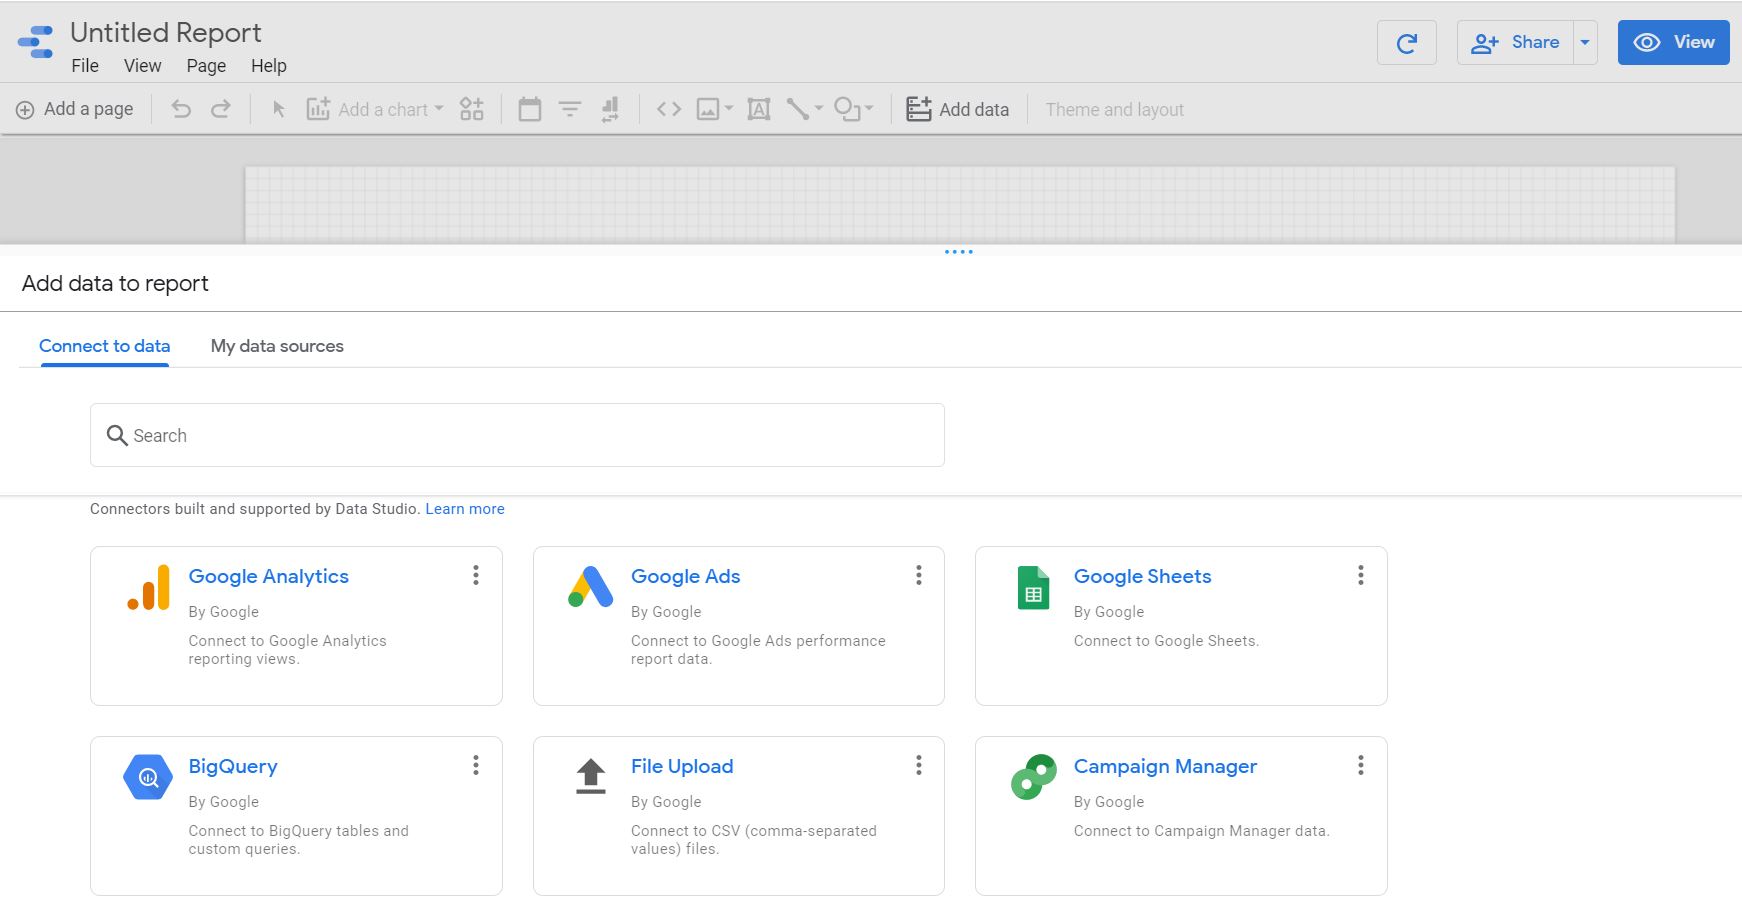
- Select File upload and then browse for the “.csv” which we generated earlier via SQL Export.
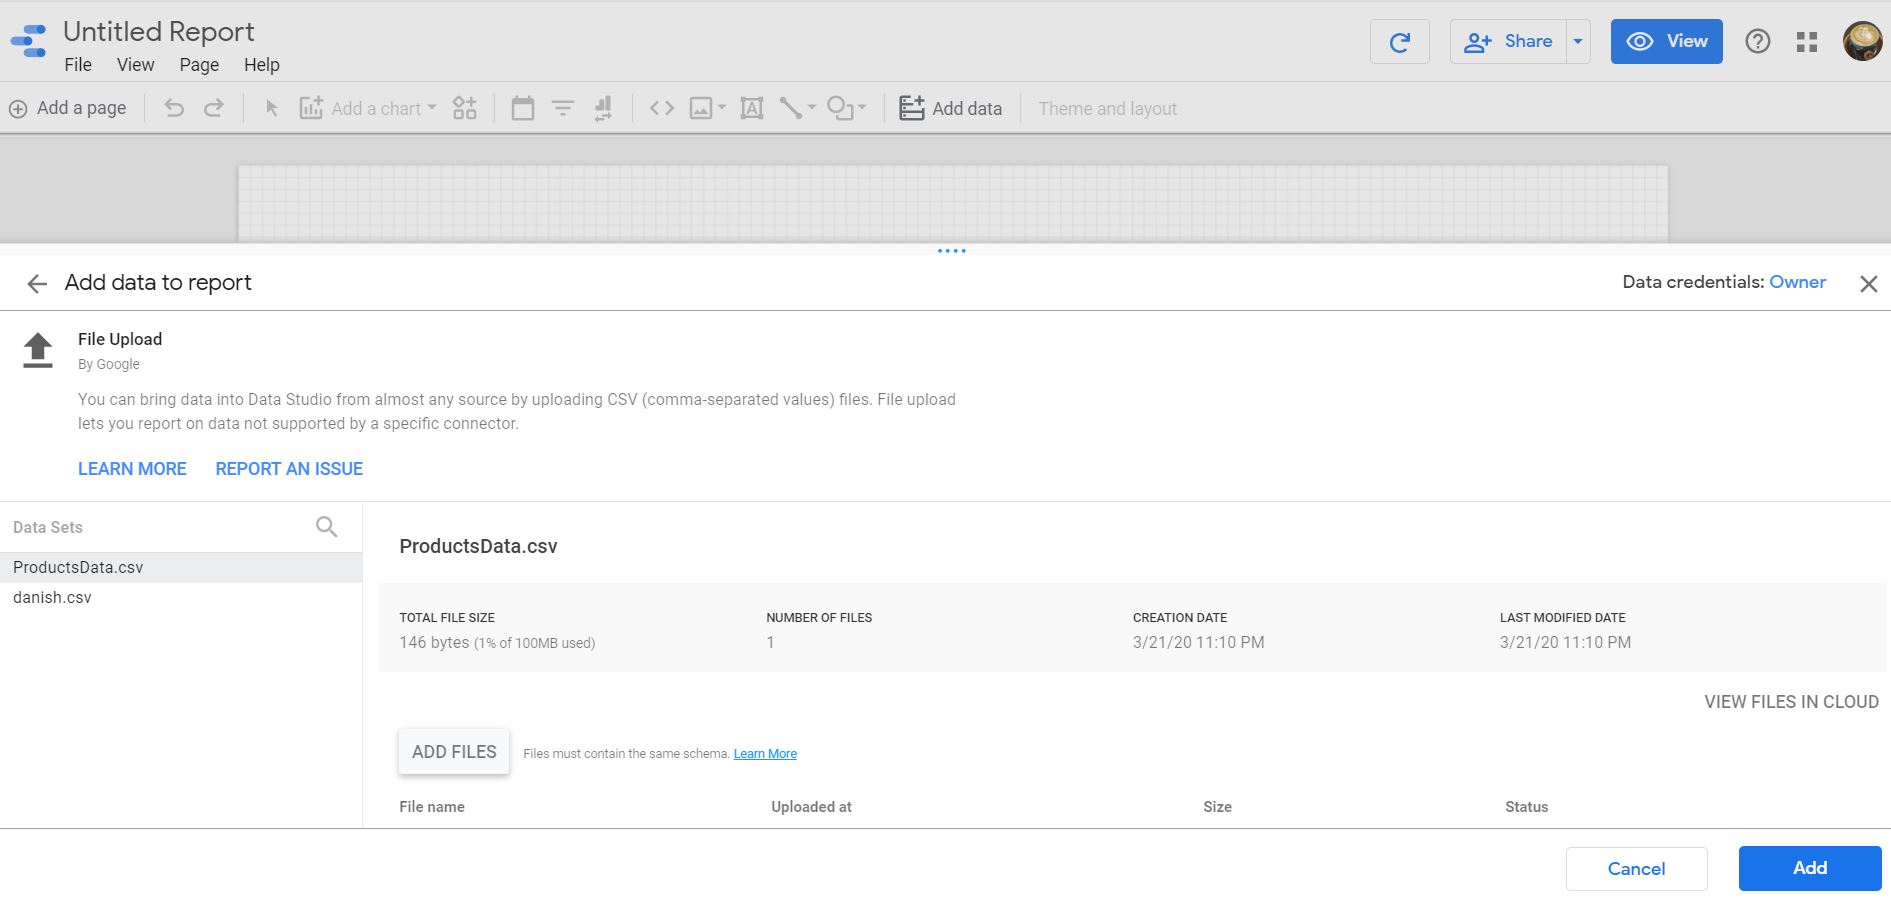
- Now, we are ready to use this data for generating a chart.
- Select Add a chart -> Bar chart.
- Add CategoryGroup as the Dimension, and TotalPrice, TotalStock as Metrics of the chart
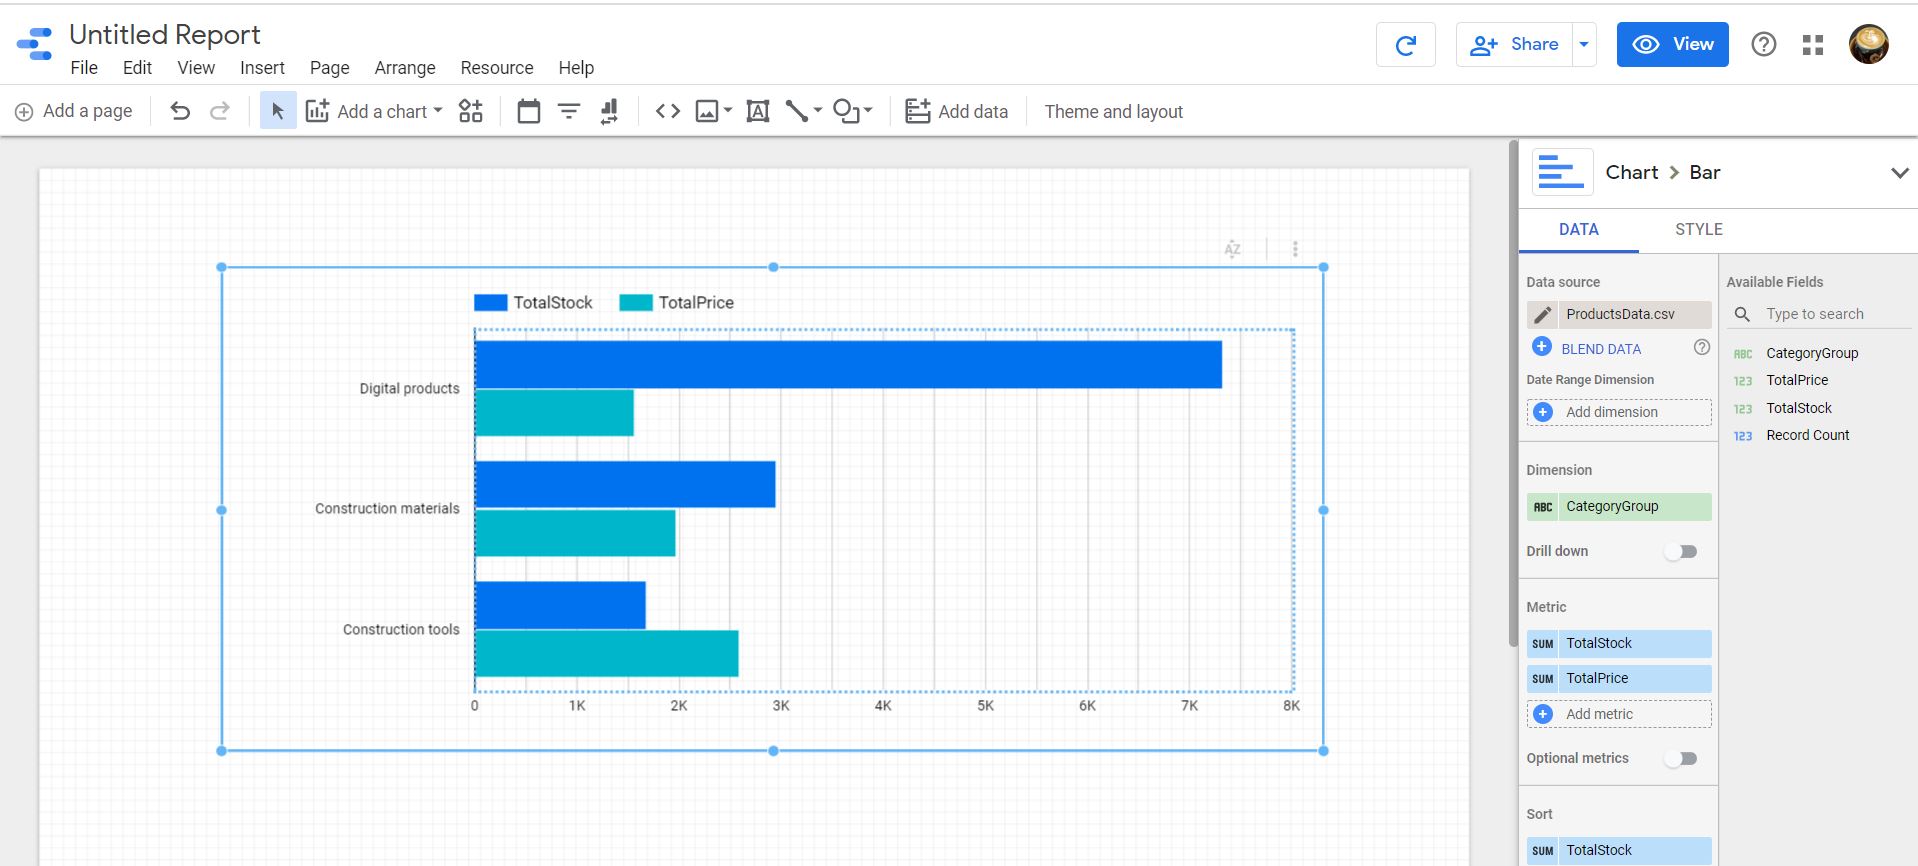
- This will generate the report. We can view the published report by clicking on View.
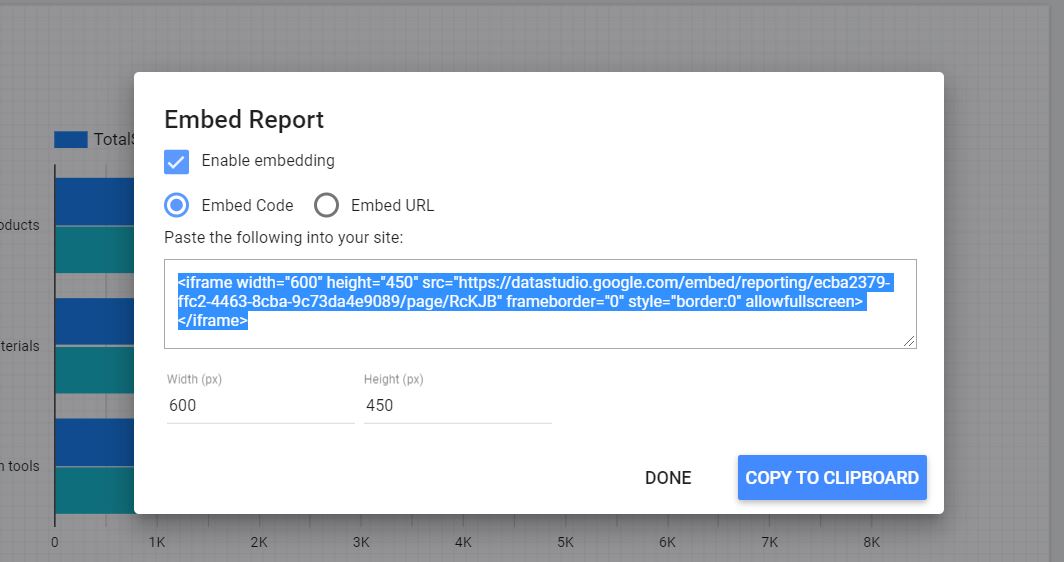
- In order to view this report in the SharePoint portal, We need to get the embed code for the report. Click on File-> Embed Report.
- This will generate the embed code. Copy the code.
- Go to SharePoint Portal and create a Page for the Report.
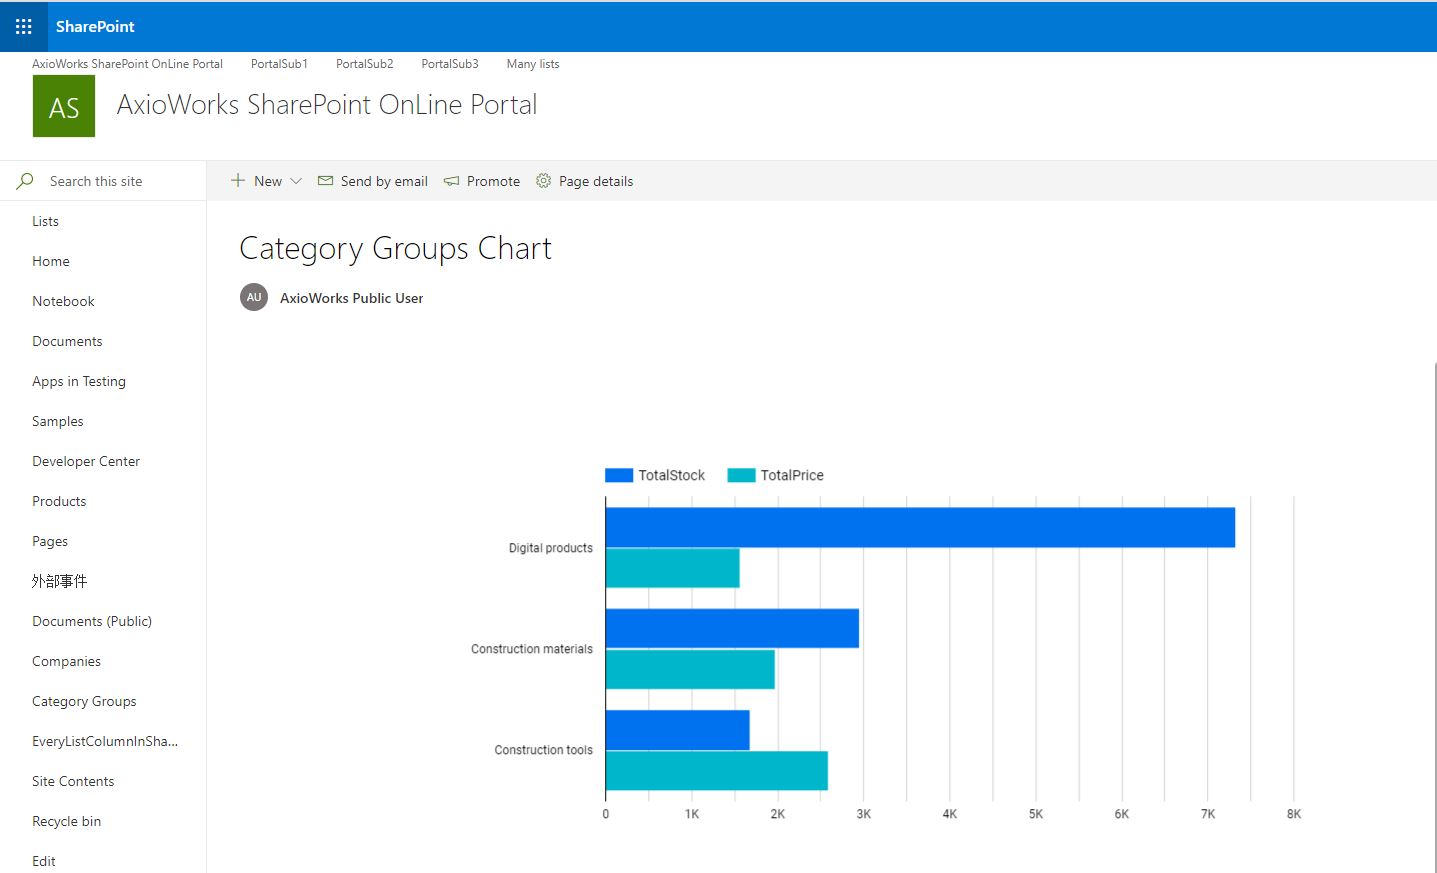
- Insert Embed <> webpart and in properties enter the embed code we copied earlier.
- This will render the report.
Conclusion
To summarize, we have gone through how to replicate and synchronize data from SharePoint lists to SQL Server database by using SQList and then export the data to Google Data Studio and use it to generate a chart. We also looked at how to embed the generated report in SharePoint Portal via using Embed <> WebPart.