In our previous article on MS Lists, we did a detailed introduction including some of the great features which can help any business in implementing use cases like issue tracking and inventory management.
In this blog, we will use MS Lists to create an issue tracking solution using an out of the box template and then we will use SQList to synchronize data between MS Lists and SQL Server database. Finally, we will use Power BI to generate charts.
AxioWorks SQList continuously export SharePoint lists and libraries as normalised SQL Server tables with SQList by AxioWorks, making SharePoint data available to reporting tools like Power BI, Crystal Reports, or SSRS.
Scenario
Create charts in Power BI which shows the categorization of issues by priority and status from Issue tracking MS List.
Step-1: Create an Issue Tracking list in MS List
Let’s start off by opening the MS List web app which you can access from the Office portal.
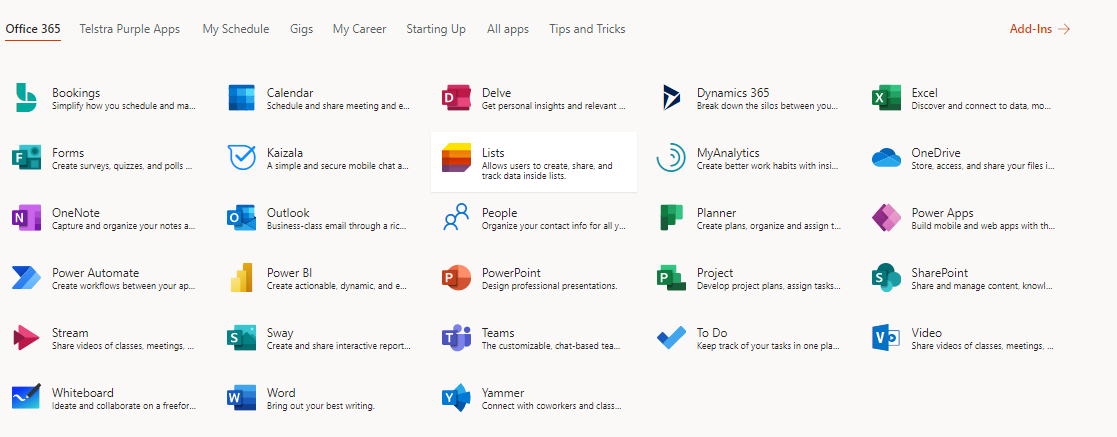
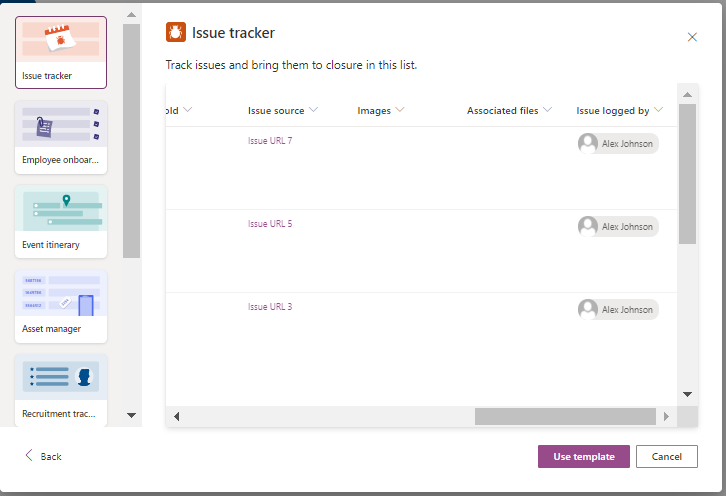
Create a new List using the Issue tracker template.
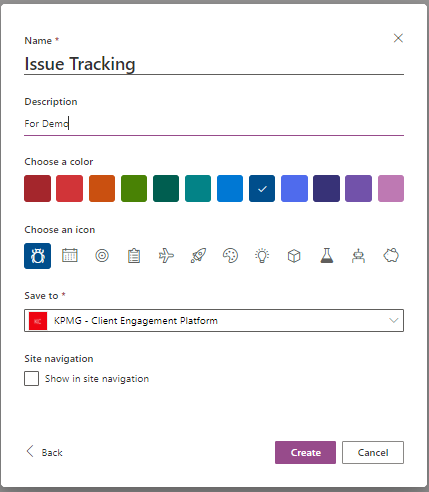
Select the SharePoint site in which you want to store the list and the icon for the list.
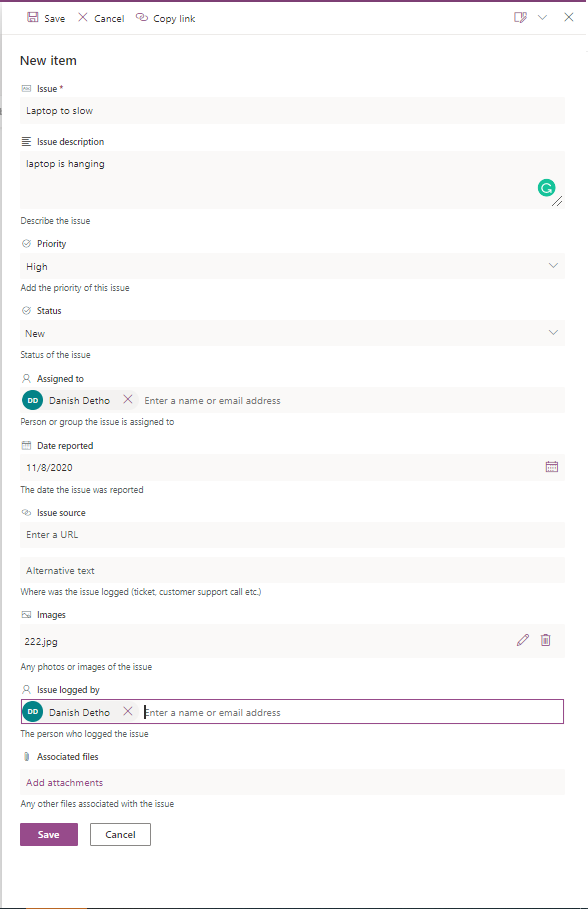
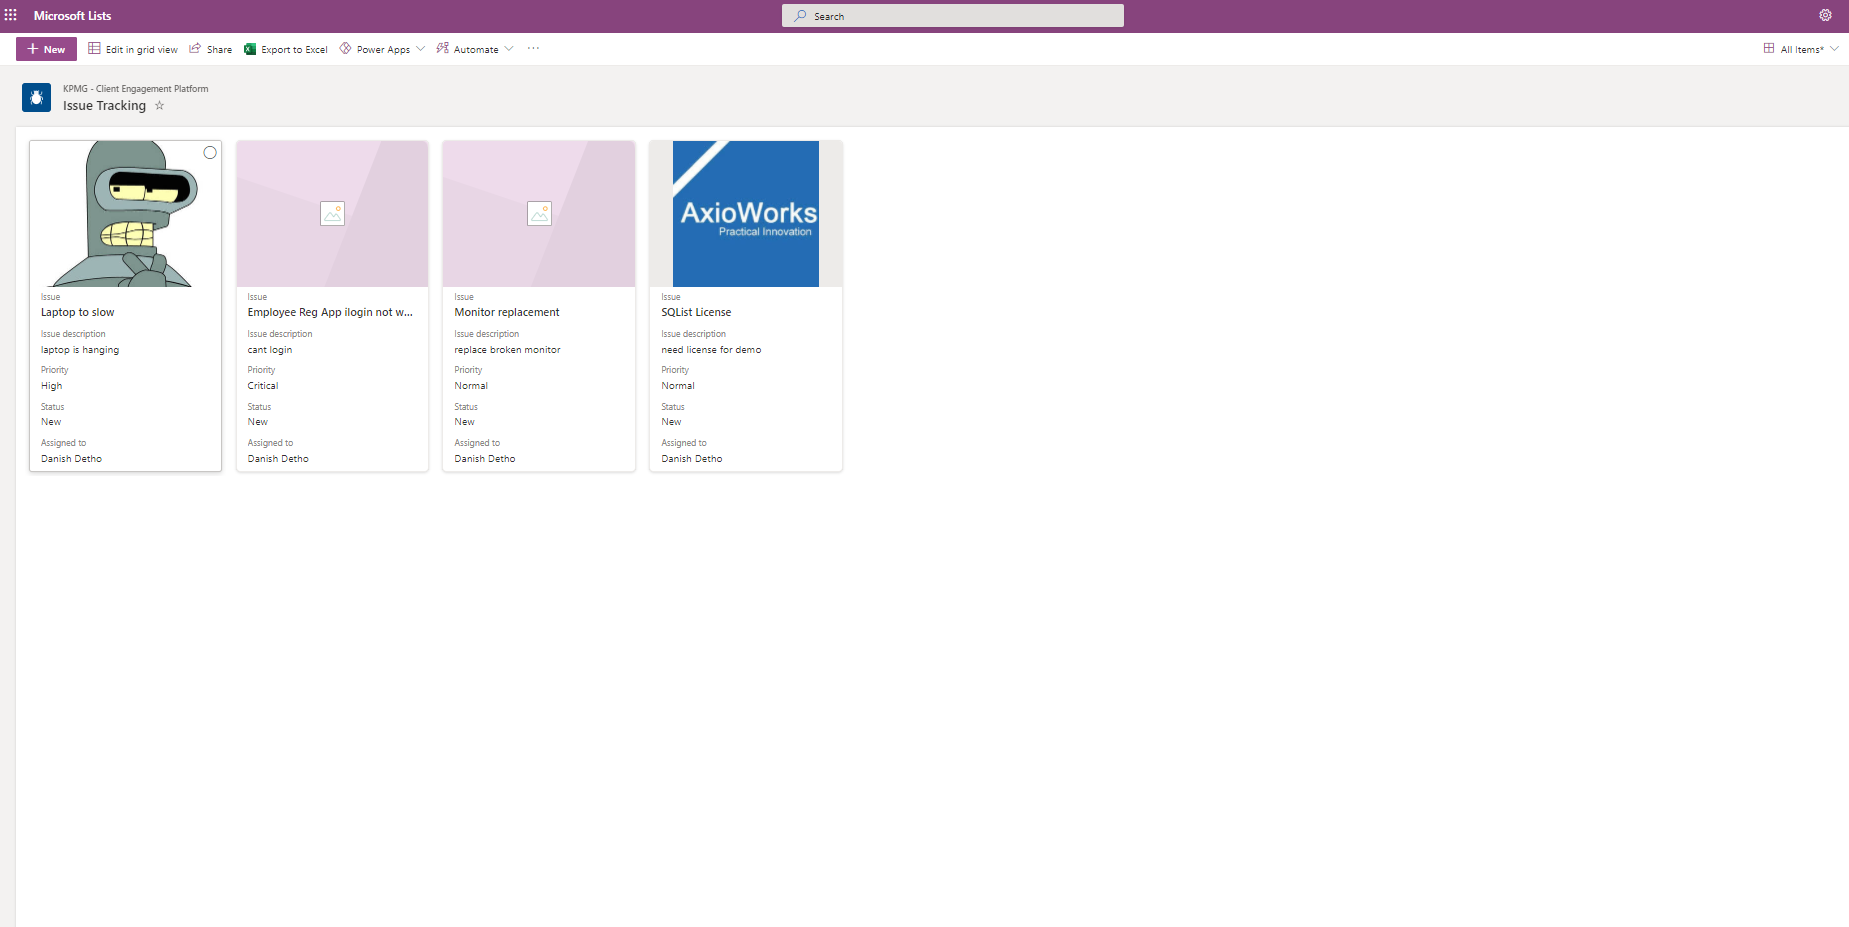
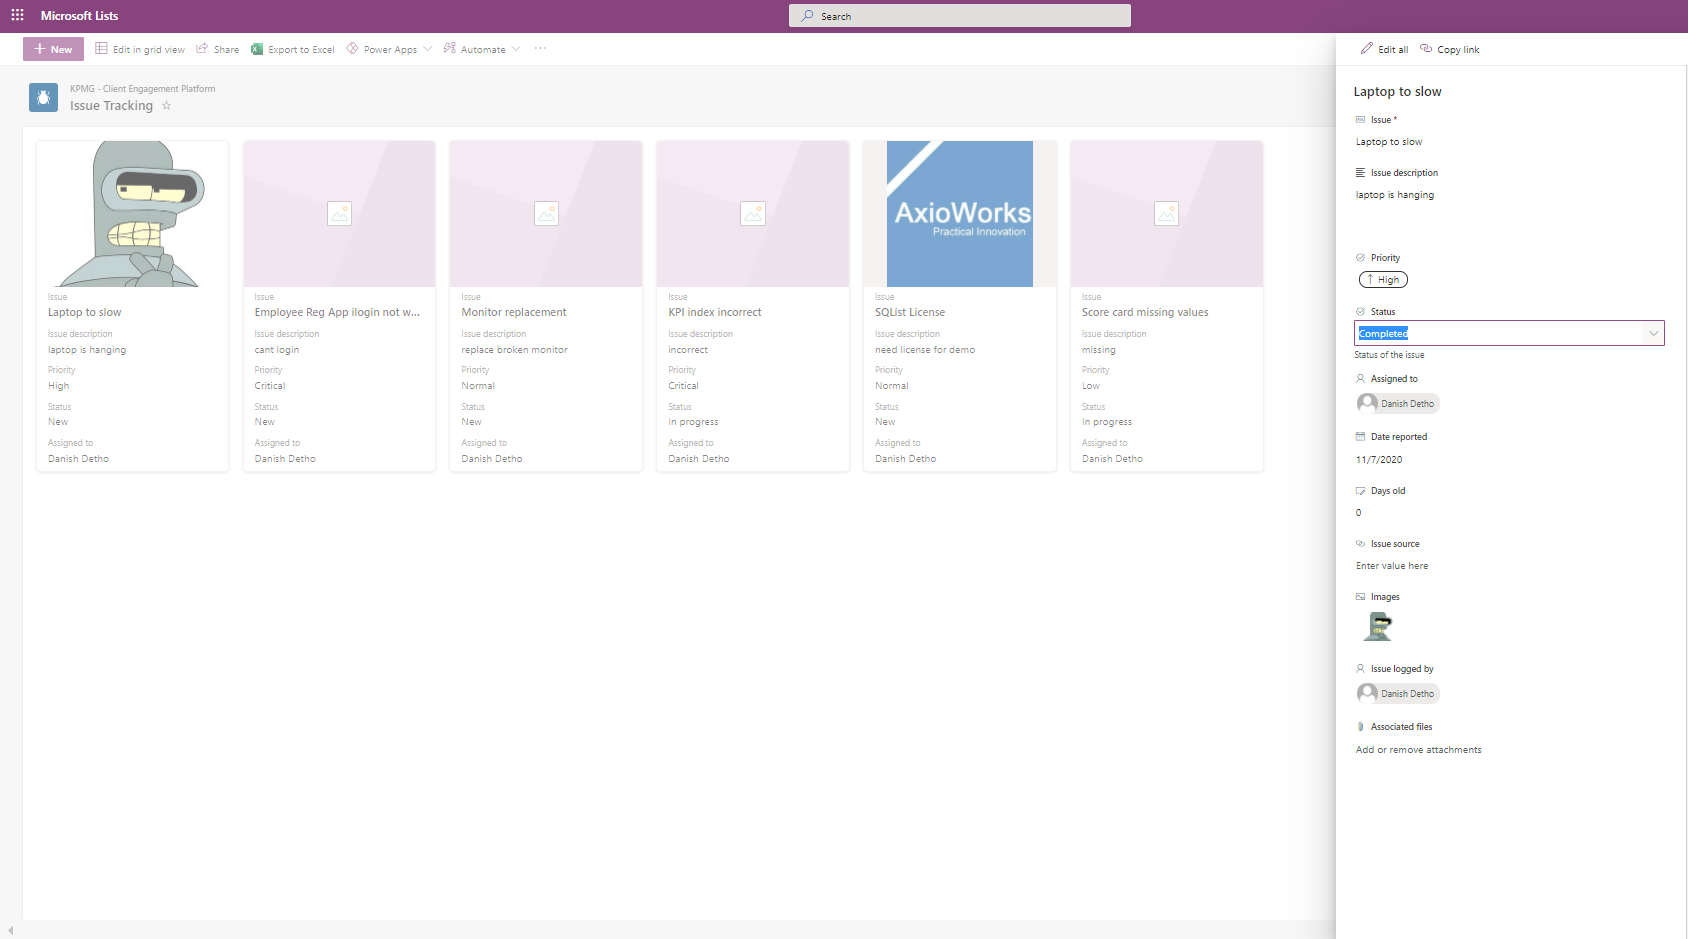
Now, add some items to the list with different values for priority and status.
To change the view, select Gallery from view which will show items in a Gallery format. Now our new list is ready for synchronization.
Step-2: Create a Database in SQL Server
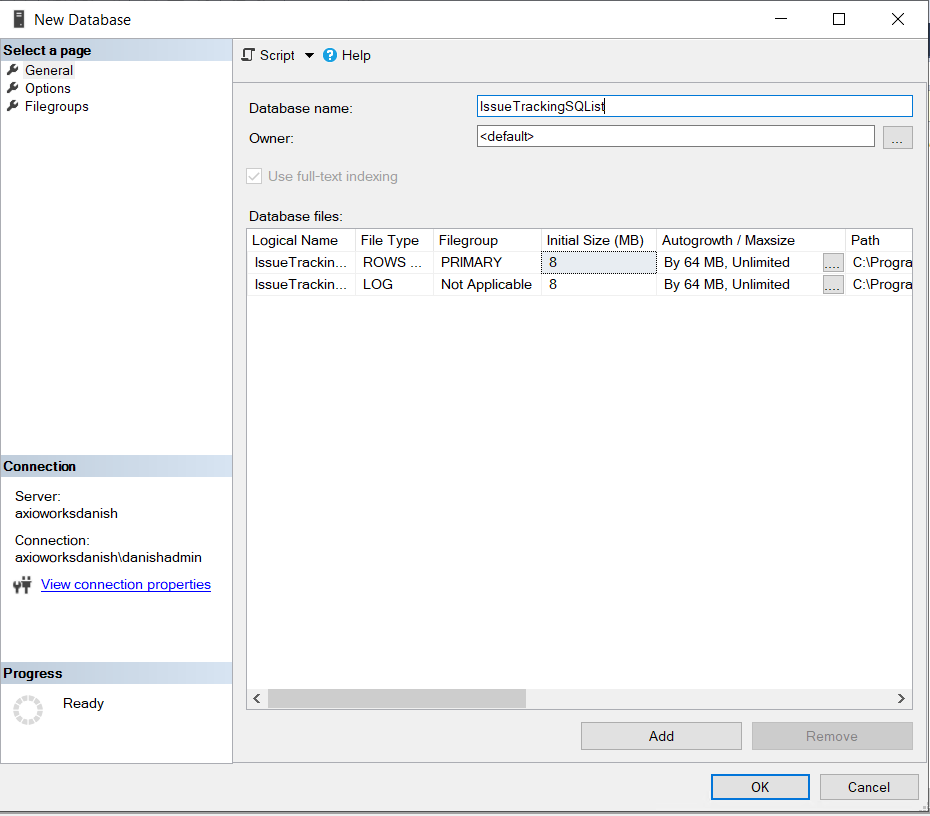
We need a database that will be used for replicating the data coming from SharePoint lists.
Open SQL Server Management Studio and create a new database named “IssueTrackingSQList ”.
Step-3: Replicate and Synchronize data to Database
Now we will replicate the data from SharePoint lists into SQL Server database. We will use SQList to achieve that.
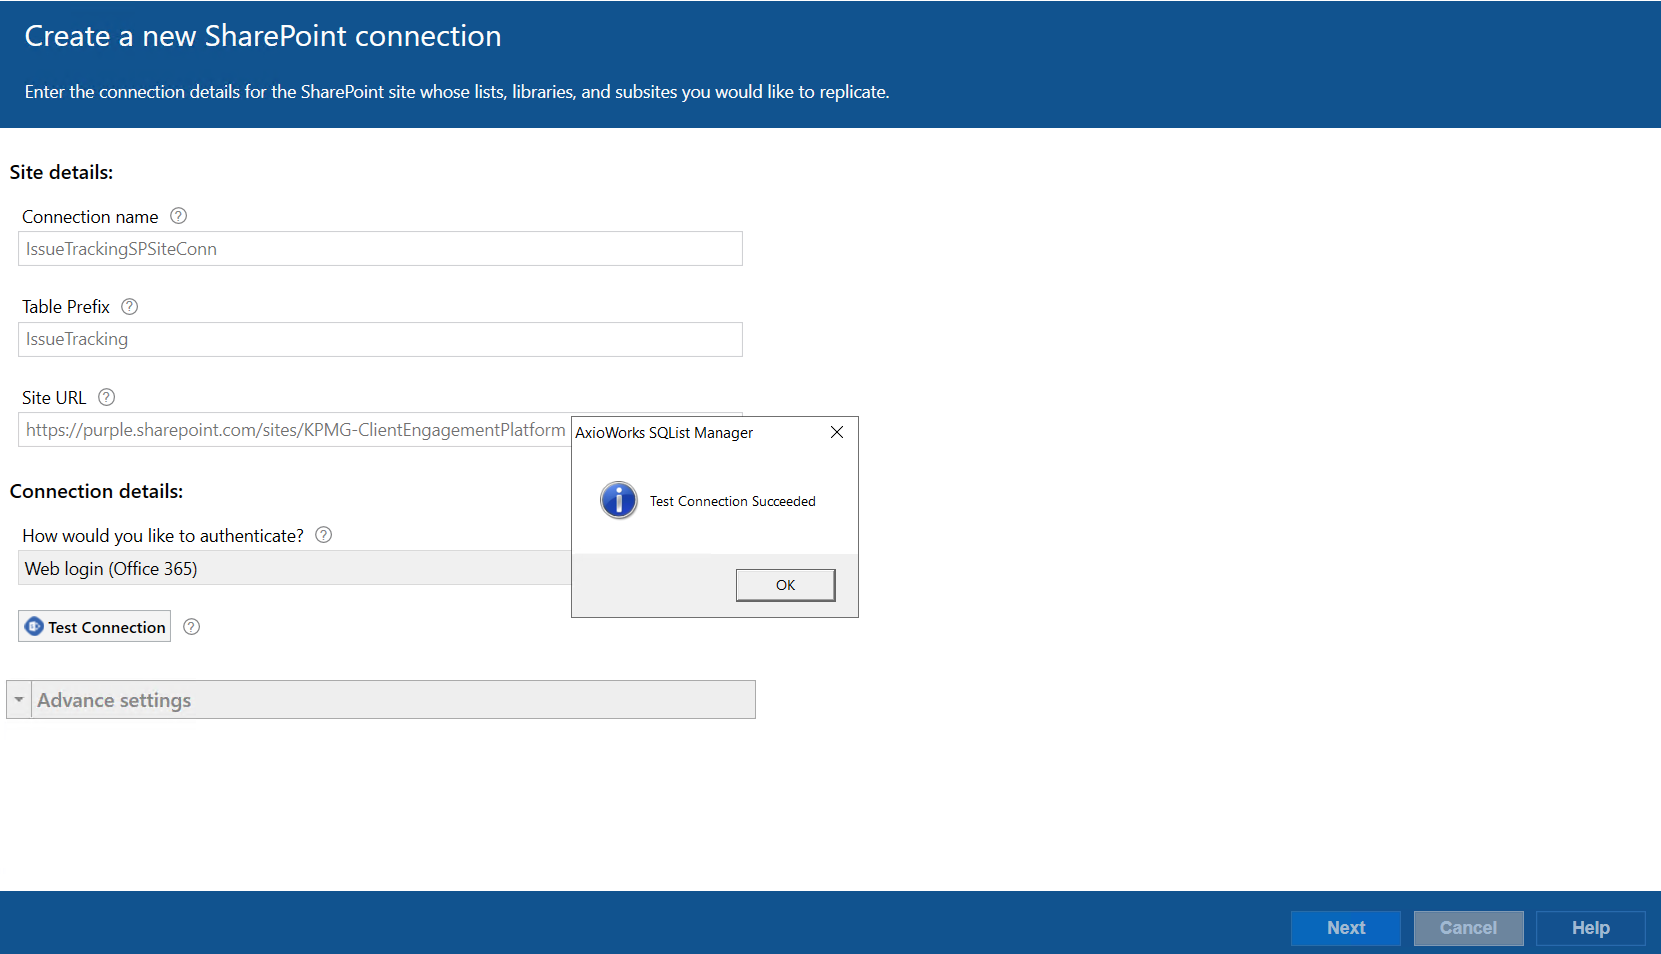
Open SQList Manager and click on “Create a new replication”.
Create a new SharePoint connection, enter the connection name and Table prefix and select the SharePoint site which contains the Issue Tracking MS list and clicks next.
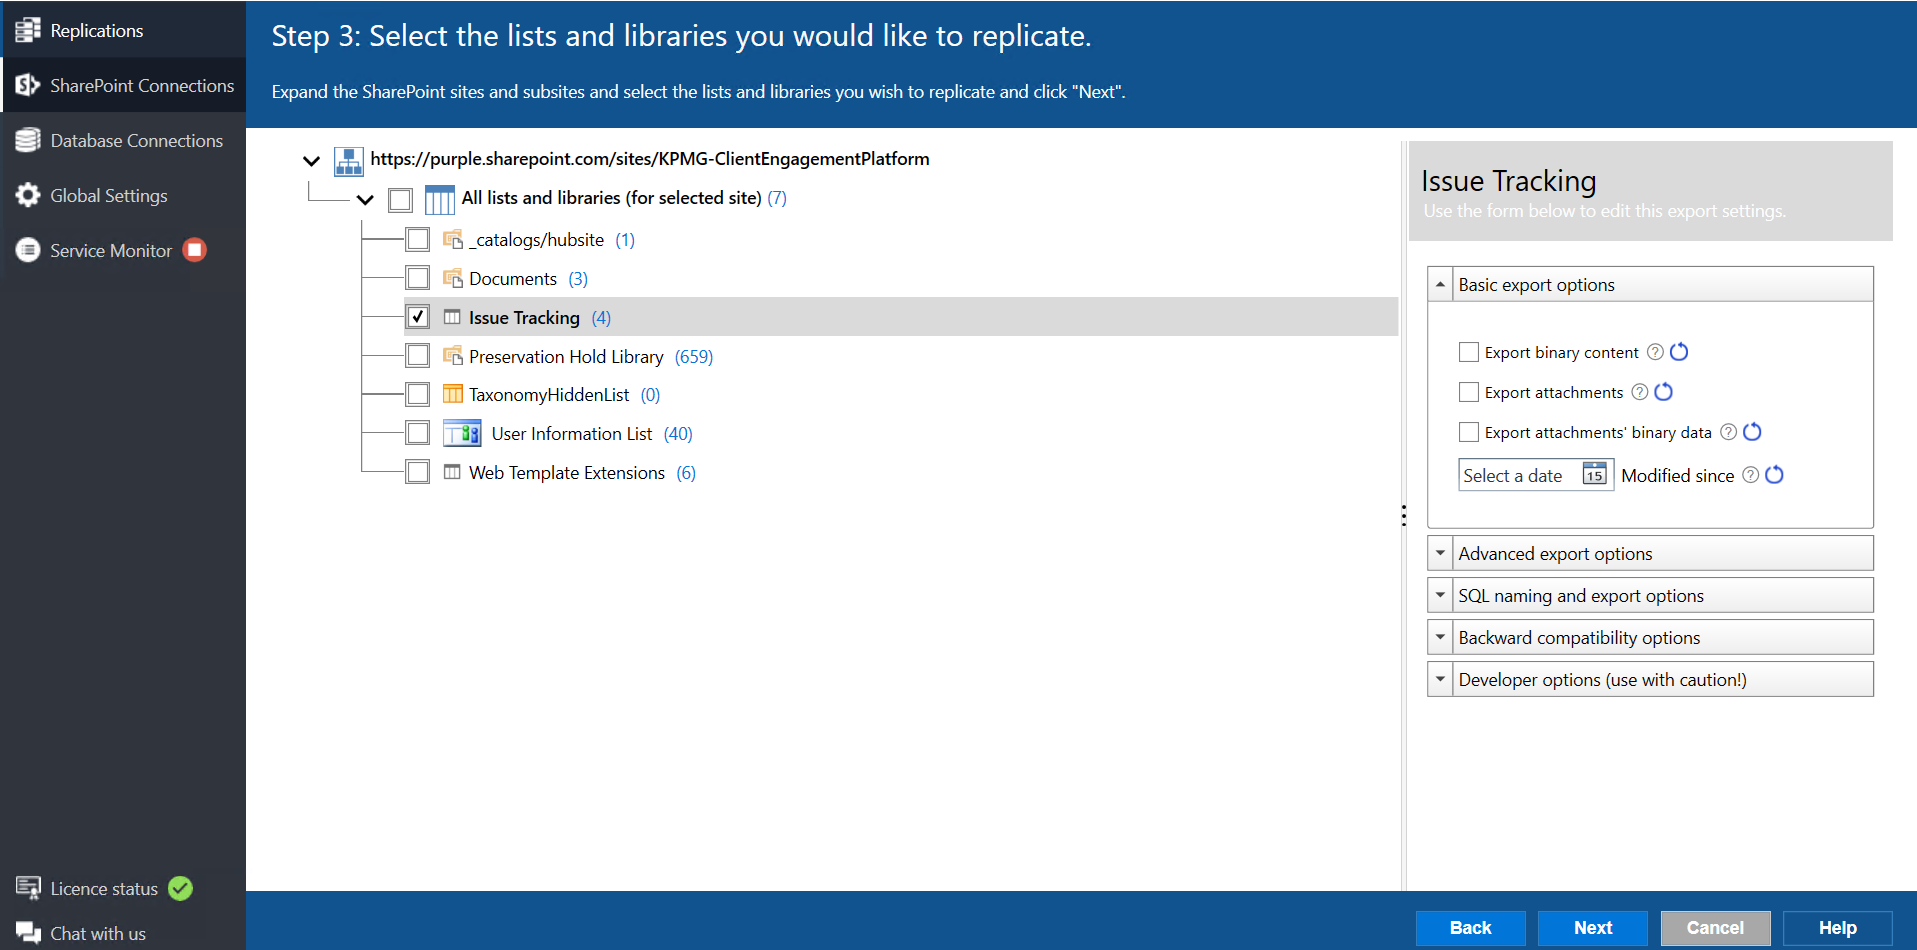
Select the replication lists, we will select the Issue Tracking MS list.
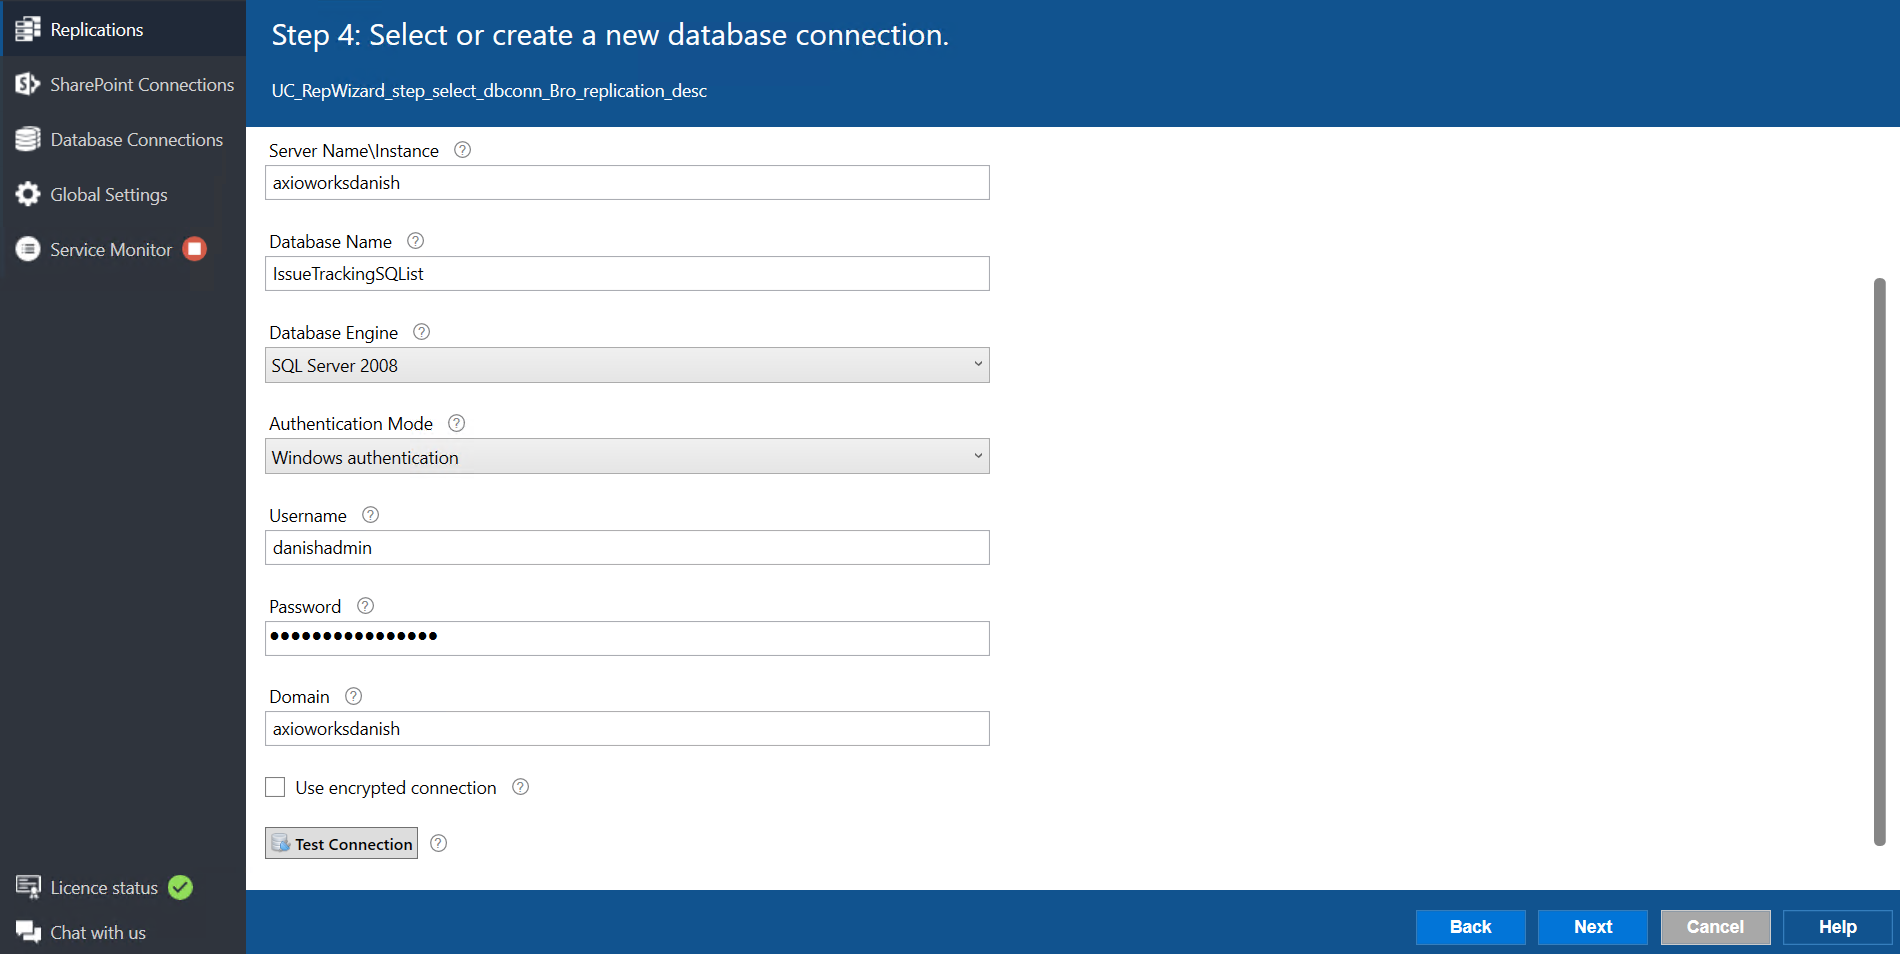
Next, enter the details for the destination SQL database connection which is the database we created earlier.
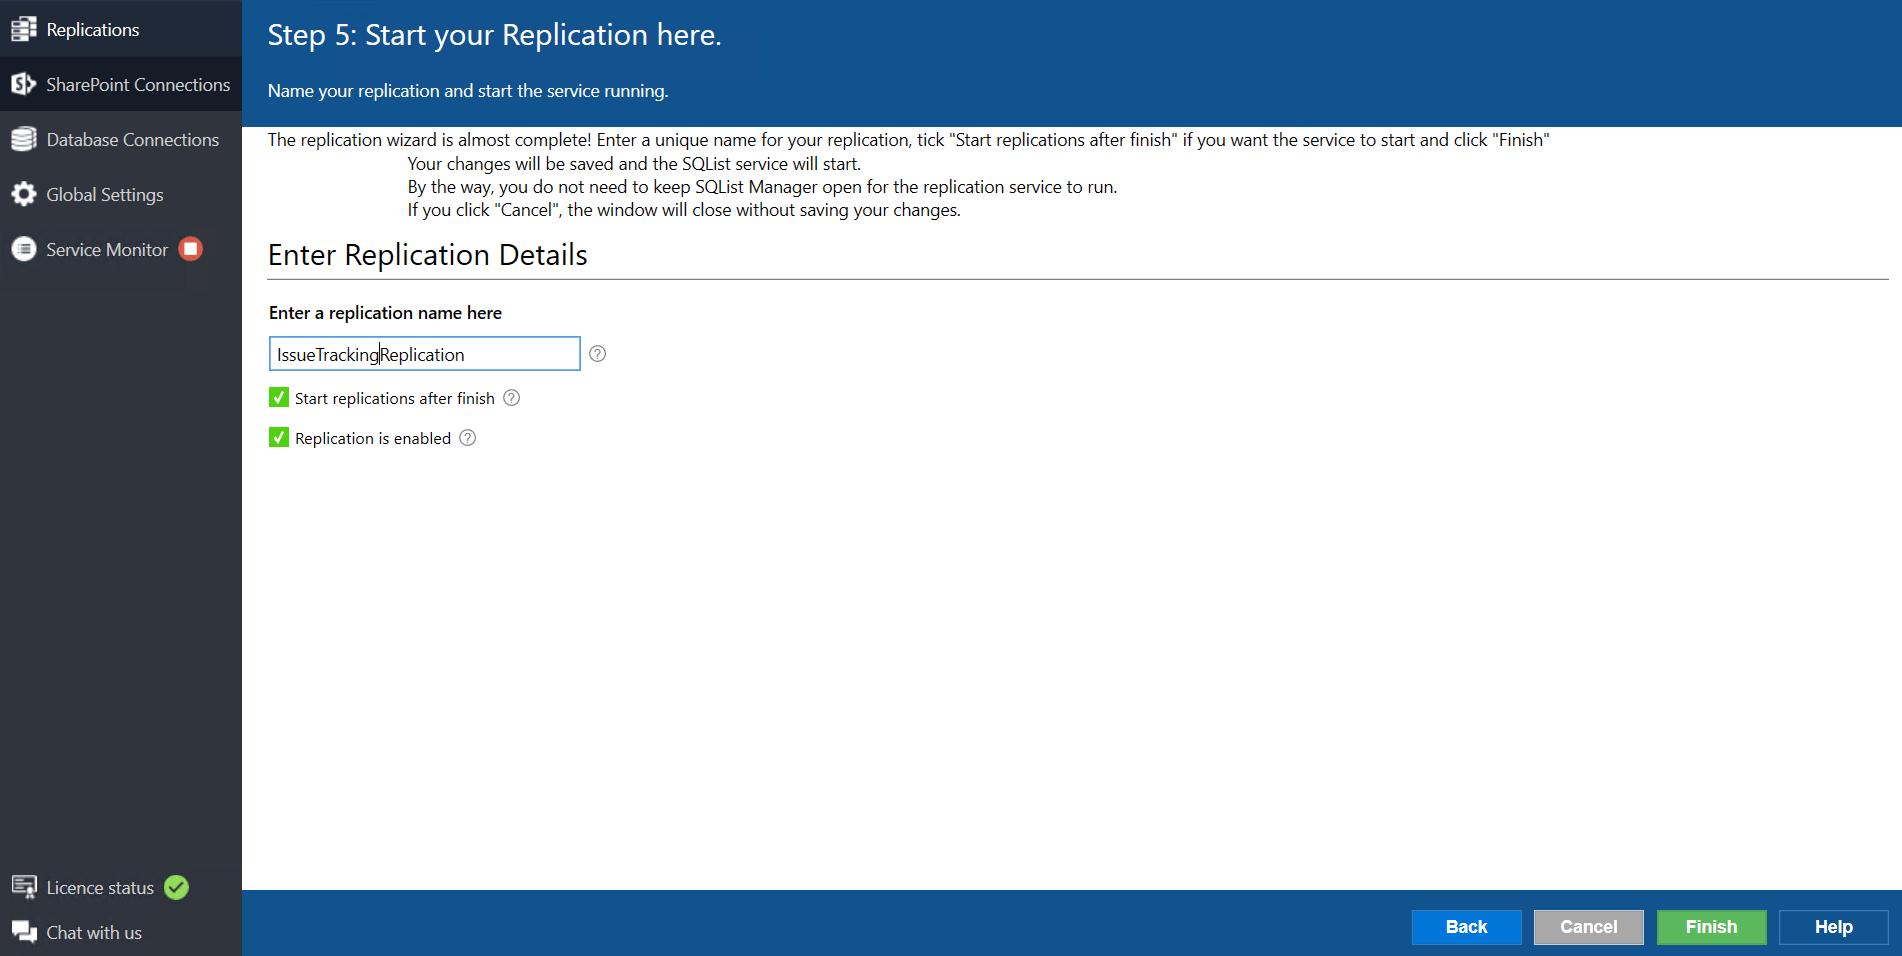
The last step is to give this replication a name, and keep the default options as checked and then click finish.
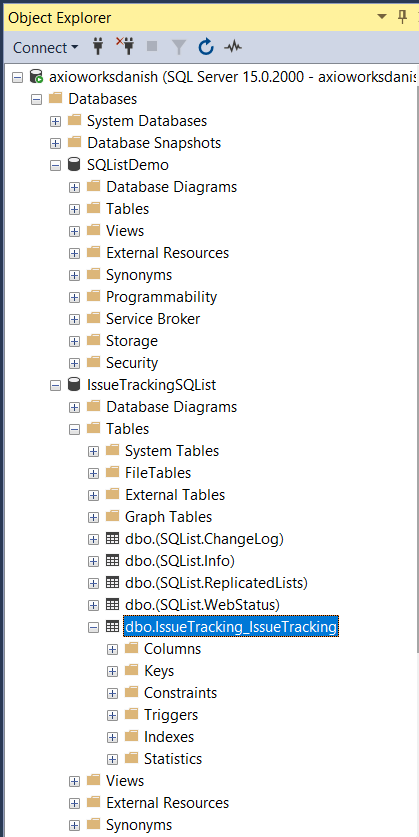
Once the replication is created, SQList replication service will start off for synchronizing the selected MS list and SQL database. The database will now have the table created or Issue Tracking List
Note: SQList will keep the database in-sync with the MS lists which means any updates made to the list will be replicated in this database as well.
Step-4: Generate a Chart in Power BI
Now that we have our data available in the database, let’s open up the Power BI desktop.
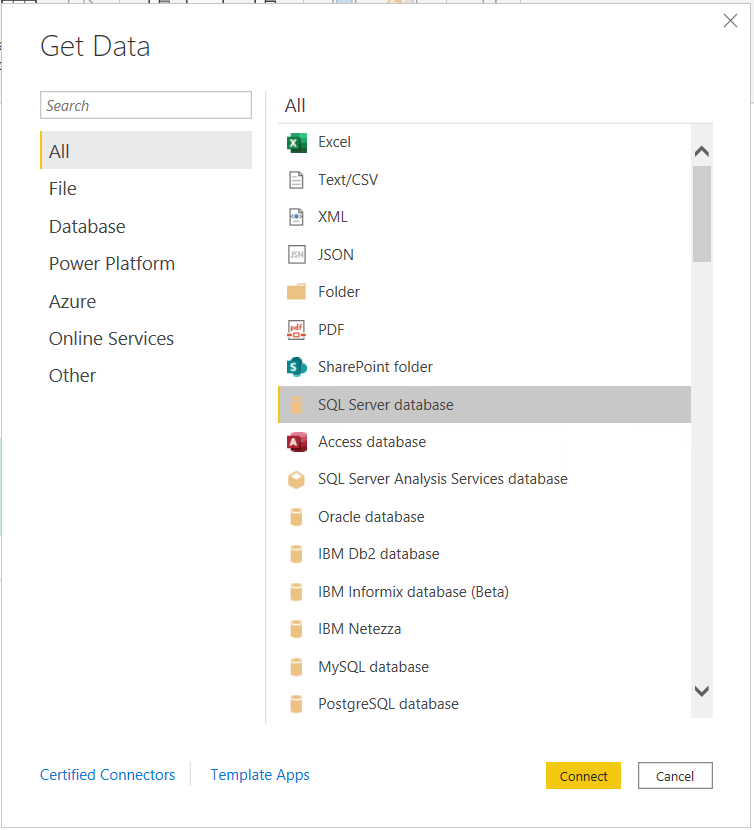
Go to Data tab and click on Get Data and select From SQL Server Database. Enter the Server and Database name which we created for the demo.
This will open the data navigator, which shows all the tables and views. Select the Issue tracking table in the navigator.
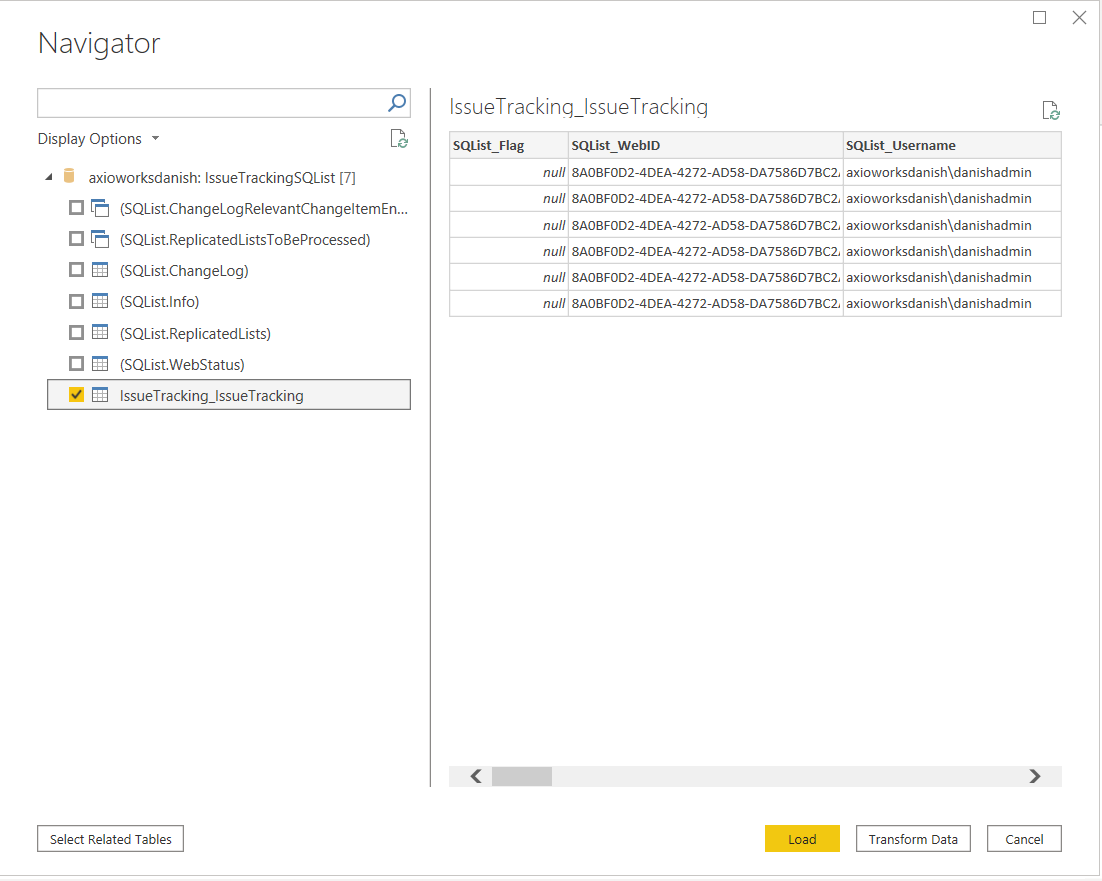
Click on Load, this will load the data table in Power BI.
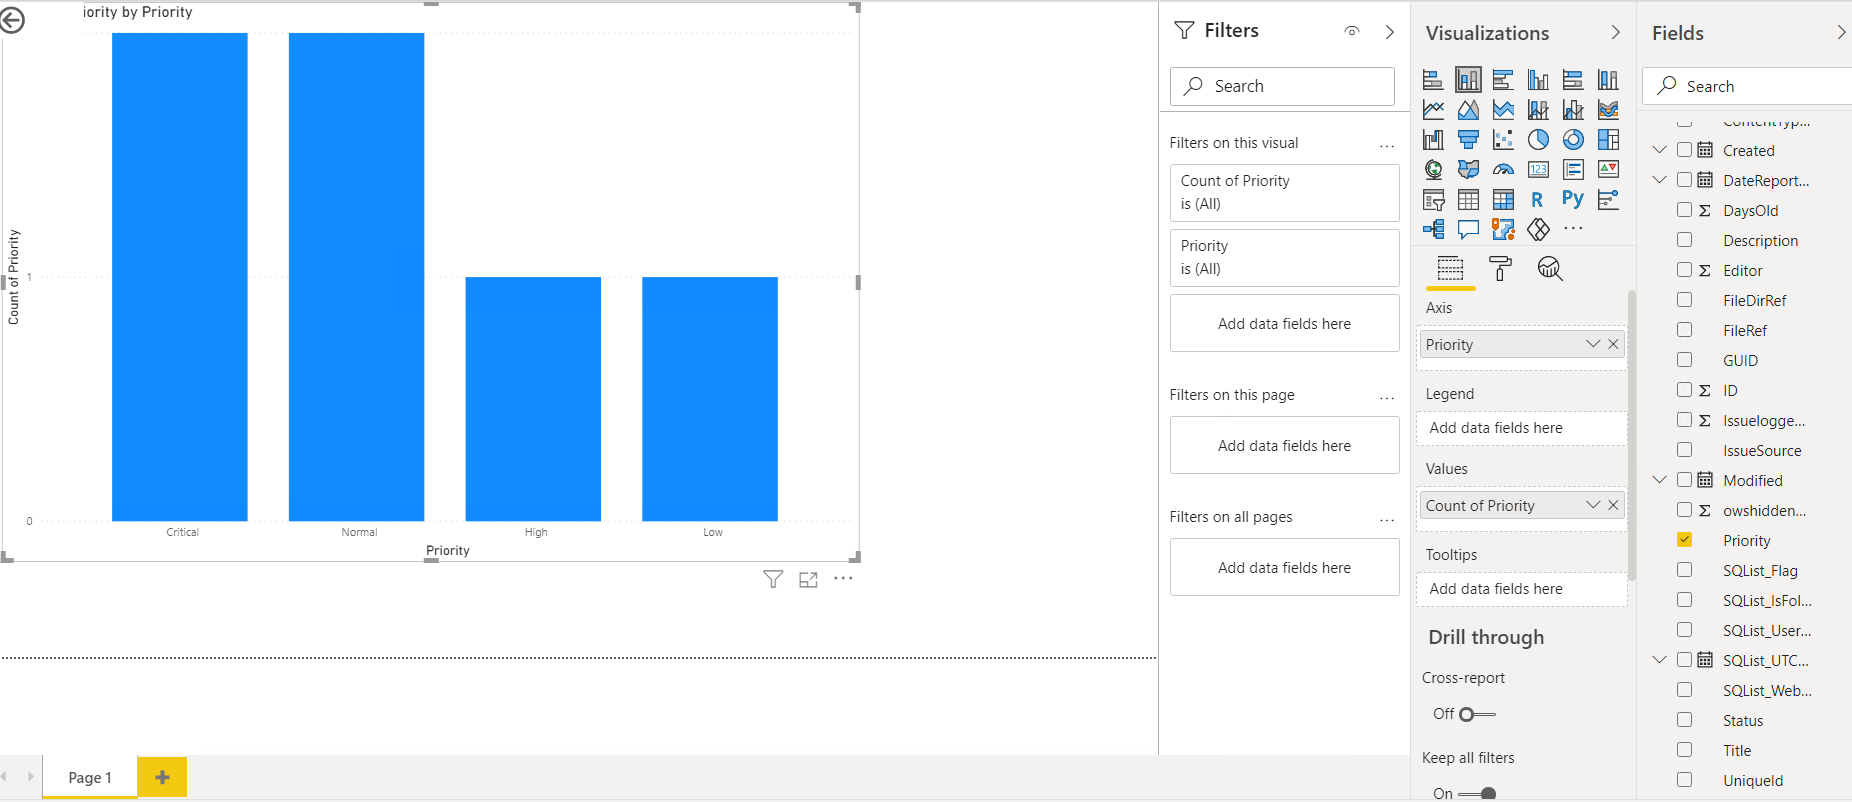
The next step is to insert the bar chart from the visualizations section on the left. Add Priority in axis and Priority in values as well. This will populate the chart with the data we selected.
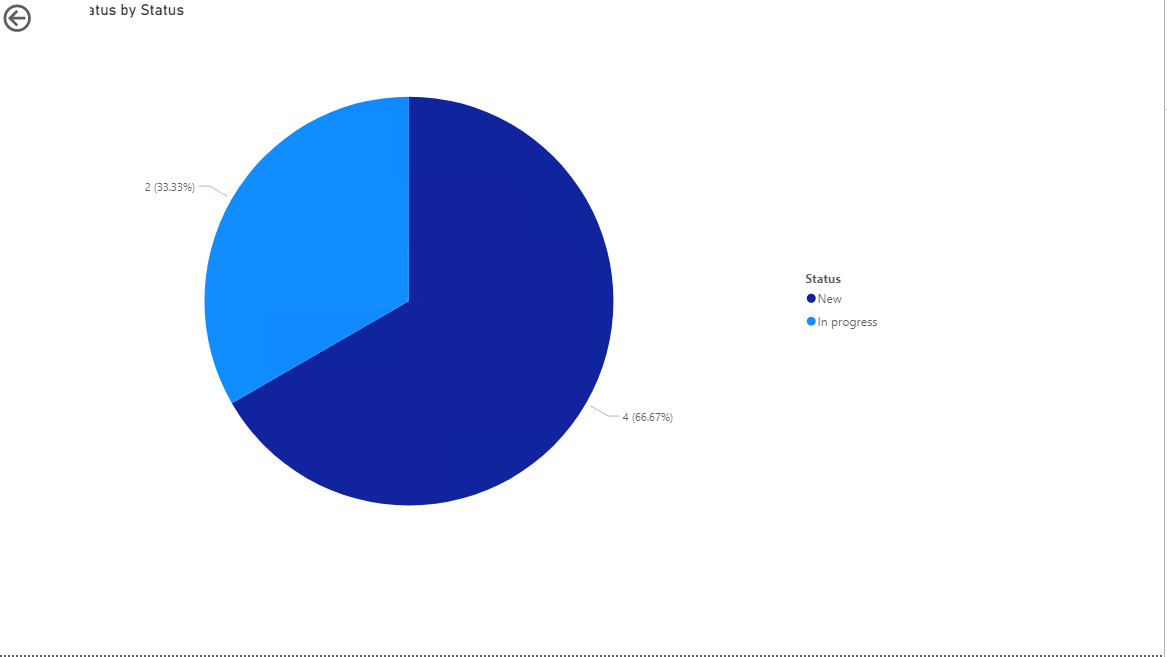
Lets, create another chart and this time use Pie Chart from the visualizations and use Status for axis and values.
Now to test the synchronization, let’s go to MS Lists and change the status of some of the items in the Issue Tracking list.
Now, go back to the Power BI report and click on refresh. You will see that our chart has been updated.

Conclusion
To summarize, today we saw how to generate charts in Power BI using live data from MS List. We used SQList for replicating and synchronizing data coming from MS lists so the chart reflects changes made to MS List in real-time. MS Lists adds great value to Office 365 by providing a fast and user-friendly way of implementing solutions like issue tracking and SQList makes it possible to use the data from MS Lists to generate reports with ease.
AxioWorks SQList continuously export SharePoint lists and libraries as normalised SQL Server tables with SQList by AxioWorks, making SharePoint data available to reporting tools like Power BI, Crystal Reports, or SSRS.