Introduction
There has been an exponential growth in SharePoint usage over the past few decades due to its vast set of capabilities to fulfill the most challenging business requirements especially transformation towards the modern workplace. One of the primary milestones on the road to the modern workplace is setting up an Intranet Portal which servers a one-stop-shop for information and communication and that’s where SharePoint shines the brightest. However, soon site owners realize the need for understanding how their portal sites are being used or not used and which features are the most popular among the users. One of the key ingredients of improving user experience is to gather insights on the site user behaviours. In order to facilitate this, Microsoft has released a new free-to-use tool called Clarity that comes with some innovative user analytics features to understand how site users are using the sites in real-time in order to help site managers improve their site experiences by better understanding site visitor behaviour. In this article, we will take an in-depth look at Microsoft Clarity, what it brings to the site, and user analytics table and how it can be integrated in the SharePoint site.
Microsoft Clarity: Make user behaviour analytics easy
Just like Managers need summarized reports and dashboards to analyse data in order to make an informed decision, Site Managers and administrators need an insight tool to analyse the site usage data and that’s essentially the primary purpose of MS Clarity. It is a free-to-use analytics product built to help site admins to improve their site user experiences by getting more clarity for site visitor behaviours. It provides a set of tools to facilitate site managers to decide what modifications they should make to their sites in order to improve the site usage. Clarity points out which parts of the site get the most and least engagement and it provides an invaluable interface for debugging. MS Clarity records information about users who visit your site, and how they behave. It summarises that information in the form of dashboards and allows site managers to explore and highlight interesting segments and behaviours.
AxioWorks SQList continuously export SharePoint lists and libraries as normalised SQL Server tables, making live SharePoint data available to reporting tools like Power BI, Crystal Reports, or SSRS.
What makes MS Clarity Great
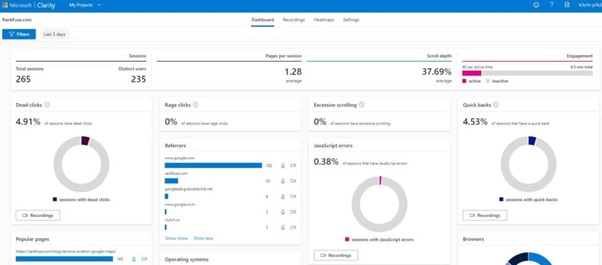
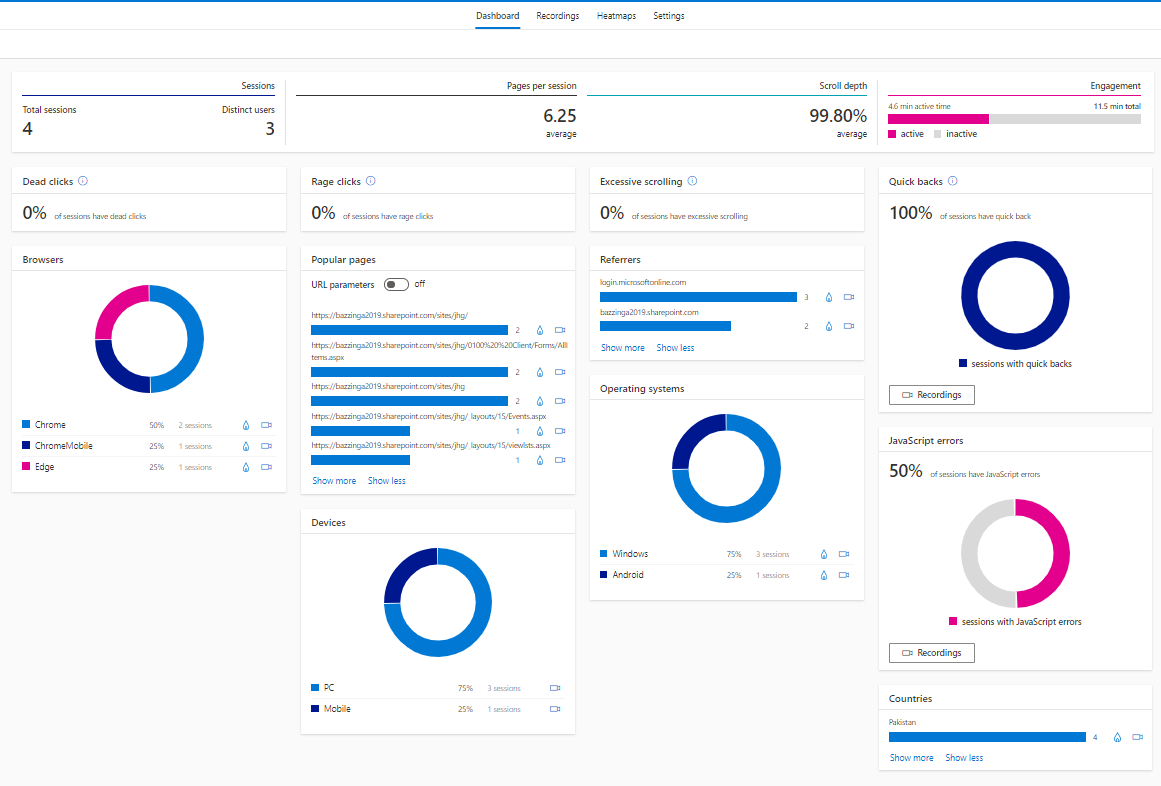
Insights Dashboard and matrices
Insights dashboard allows site managers to view aggregated metrics on the site analytics to understand your site’s traffic.it provides information like how many users were clicking on links that don’t exist, how many people scrolled up and down a page looking for information, average time users were active on the site, were JavaScript errors, and the average time a user spends on your site. There are some unique reports as well like ‘rage clicks’ and ‘excessive scrolling’ which show users who might have been confused or annoyed.
Session recording
MS Clarity also includes a great session recording tool that provides recordings of user sessions on the site. It logs the mouse movements, scrolling, and clicks of every visitor to the site. These records can help you to better understand your user’s behavior and identify their problems. These session recordings can be viewed and replayed at any time in the future.
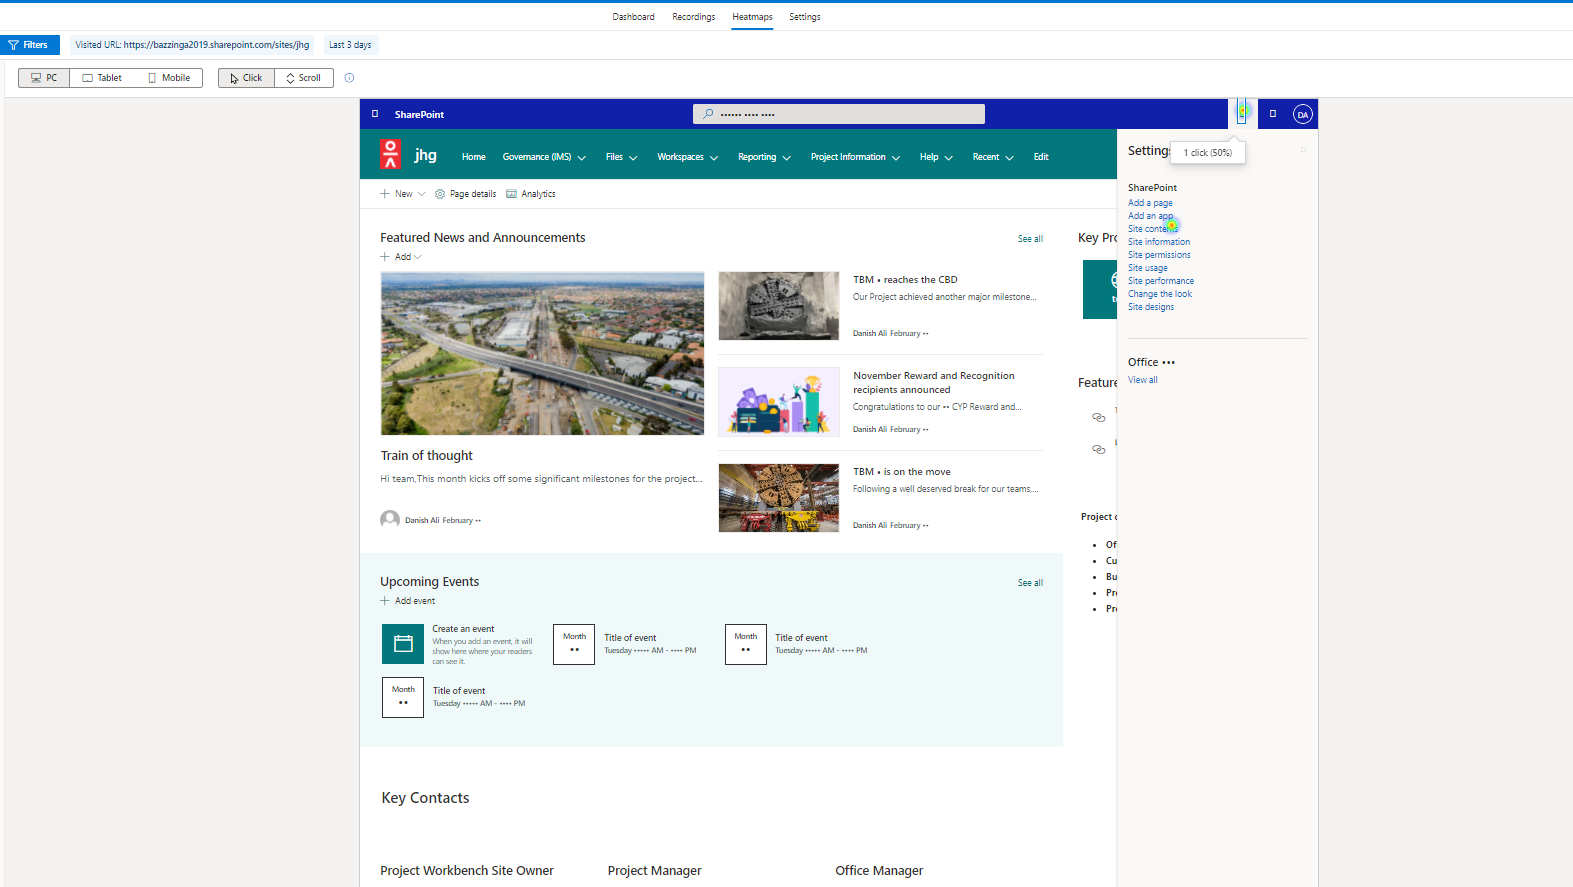
Heatmaps
Clarity Heatmaps tool helps us to understand how users behave while they are on a specific page which includes what areas they are clicking on. For example, if there is an underlined text and the user is clicking on it then it means that the user is confusing it for a hyperlink. This kind of view can help UX designers to understand what their users want and which segments of designs and layout might be confusing them.
Bringing MS Clarity to SharePoint site
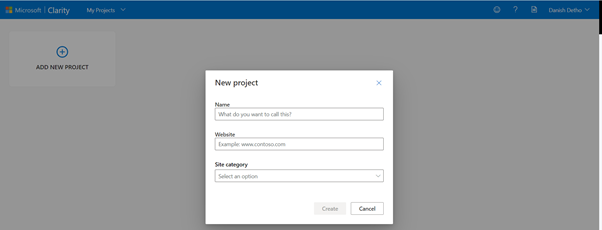
Now, lets take a look at how we can use MS Clarity for a SharePoint Site. Go to the Clarity website at https://clarity.microsoft.com/ and sign in using your Microsoft account. Then click on create a ‘project’. On the website, enter your SharePoint site address.
Once that’s done, you will see a setup screen with Clarity tracking code “Highlighted” which you will need to connect your SharePoint site to this project.
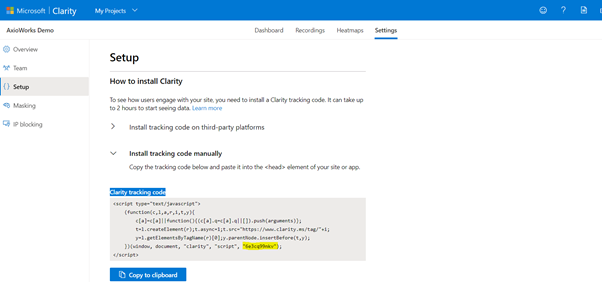
Once you get the unique identifier for the Microsoft Clarity project it’s time to get the Clarity in your SharePoint environment. This can be done by using an App Customizer using your clarity tracking code. There is a prototype solution available on GitHub which you can download from here. Upload the solution package in your preferred App Catalogue and then Deploy the package.
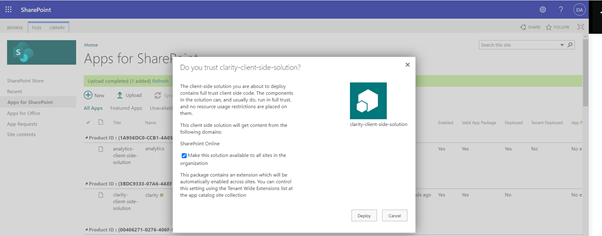
Now the App Customizer will be available for installation on all the sites of your organization. Use the following Powershell script to install it on any SharePoint Site.
Connect-PnPOnline -UseWebLogin -Url “Your Site URL”
Add-PnPCustomAction -ClientSideComponentId “7f8fd1f2-9d26-4a4a-a607-bf4622d7ec11” -Name “Microsoft Clarity” -Title “Microsoft Clarity” -Location ClientSideExtension.ApplicationCustomizer -ClientSideComponentProperties: ‘{“clarityID”:”yourOwnId”}’ -Scope site
Note: Replace yourOwnId with Clarity tracking code
That’s it, It takes around one to two hours for clarity to set up the dashboard and start receiving user analytics data from your SharePoint site. Refresh the dashboard and once its ready, you will see a dashboard with all the matrices.
The Heatmaps section will show which areas of the site are most/least clicked by users.
To Summarize
AxioWorks SQList continuously export SharePoint lists and libraries as normalised SQL Server tables, making live SharePoint data available to reporting tools like Power BI, Crystal Reports, or SSRS.
MS Clarity does come with some great features that can certainly help SharePoint site managers to understand the site user behaviour and study the user sessions in order to make changes to the site which can improve the user experience. But is this an alternative to a more mature Site Analytics suite like Google Analytics, I would say “No” and in fact, it is not meant to be an alternative as well and can easily be used alongside it to get the best of both worlds by connecting your Project to your Google Analytics account. It is targeted towards both Site Managers to review and compare site analytics data via a large set of matrices and UX designers to review user sessions and heat maps to understand user behaviour and more importantly identify the improvements which can help remove the complexities from the site.